Inserting a Chart
Microsoft Office Specialist To create a chart in a Word document, you start by using Microsoft Graph to insert a sample chart and a datasheet into the document. A datasheet looks similar to a table and displays data in rows and columns. The chart is linked to the datasheet and plots its data.
After inserting the sample chart and datasheet, you replace the sample data with your own in much the same way you would enter information in a table. Because the datasheet is linked to the chart, when you change the values in the datasheet, the chart changes as well.
| Important | To make changes to your data, always alter the data in the datasheet, not in the chart. You can change the appearance of the chart, but not the values it plots. |
To enter data in an individual cell—the intersection of a row and column—you click the cell to select it, and start typing. You can select an entire column by clicking the column heading—the gray box at the top of each column, and an entire row by clicking the row heading—the gray box to the left of each row. To select the entire datasheet, you can click the Select All button, the gray box in the upper-left corner of the datasheet.
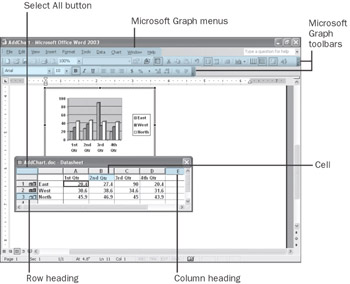
While you are working with a chart in a Word document, the Microsoft Graph commands and buttons replace Word’s on the menu bar and toolbars so that you can work with the chart directly in the document.
In this exercise, you will add a chart to a document and then customize the datasheet’s sample data.
| BE SURE TO | start Word before beginning this exercise. |
| USE | the AddChart document in the practice file folder for this topic. This practice file is located in theMy Documents\Microsoft Press\Word 2003 SBS\WorkingChart\InsertingChart folder and can also be accessed by clicking Start/All Programs/Microsoft Press/Word 2003 Step by Step. |
| OPEN | the AddChart document. |
-
Press [CONTROL]+[END].
The insertion point moves to the end of the document.
-
On the Insert menu, point to Picture, and then click Chart.
A sample chart and datasheet appear.

View Datasheet
Troubleshooting If you can see the chart but not the accompanying data- sheet, click the View Datasheet button on Microsoft Graph’s Standard toolbar.
-
Drag the title bar of the datasheet window so that the window is positioned below the sample chart.
-
Click the Select All button in the upper-left corner of the datasheet, and then press the [DEL] key.
The sample data and sample chart are deleted, leaving a blank datasheet and chart area.
-
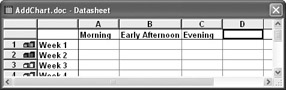
Click the first cell in row 1 to the left of column A, type Week 1, and press the [ENTER] key.
Graph enters the heading and moves the insertion point to the next cell in the same column.
-
Pressing [ENTER] to move from cell to cell, type headings for Week 2 through Week 8.
Tip You can use the keyboard to move around the datasheet, as follows: Press [ENTER] to move down in the same column or [SHIFT]+[ENTER] to move up, and press [TAB] to move to the right in the same row or [SHIFT]+[TAB] to move to the left. Or you can press the arrow keys to move up, down, left, or right a cell at a time.
-
Click in the first cell in column A above row 1, type Morning, and press the [TAB] key.
Graph enters the heading and moves the insertion point to the next cell in the same row.
-
Type Early Afternoon, and press [TAB].
-
Type Evening, and press [TAB].
-
Point to the border between the column B and column C headings, and when the pointer changes to a double-headed arrow, drag to the right until column B is wide enough to fit its entry.
Tip You can also double-click a border between column headings to size the column to the left to fit its longest entry.

Toolbar Options
Troubleshooting Because Graph’s toolbars might not be familiar to you, we show them on separate rows. If you want your toolbars to look like ours, click the Toolbar Options button at the right end of one of the toolbars, and then click Show Buttons on Two Rows.
-
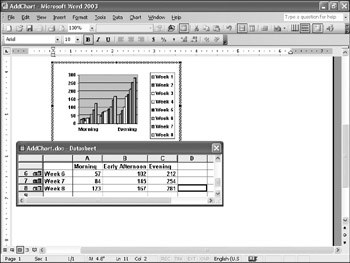
Type the following data into the chart’s datasheet:
A
B
C
Morning
Early Afternoon
Evening
1
Week 1
24
45
58
2
Week 2
29
69
81
3
Week 3
17
74
101
4
Week 4
32
78
167
5
Week 5
35
89
178
6
Week 6
57
102
212
7
Week 7
84
145
254
8
Week 8
123
167
281
As you enter data, the chart changes to reflect what you type.
-
Click the cell in column C of row 2 (which contains 81), type 99 to change the data, and then press [ENTER].
The column in the chart that represents this value is now slightly taller.
-
Click a blank area of the document to deselect the chart, and scroll up to see the relationship of the chart to the text of the document.
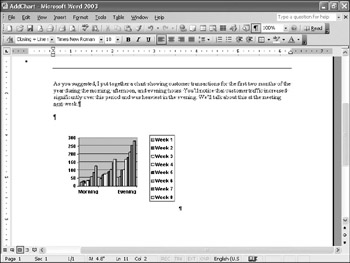
Notice also that Word’s own toolbars and menus are once again active.

Save
-
On the Standard toolbar, click the Save button to save the document.
CLOSE the AddChart document.
EAN: 2147483647
Pages: 156