Performance Logs and Alerts
Performance Logs and Alerts, a service in Windows 2000, improves the logging and alert capabilities that were provided in Windows NT 4.0. Logging is used for detailed analysis and record-keeping purposes. Retaining and analyzing log data collected over a period of several months can be helpful for capacity and upgrade planning.
Windows 2000 provides two types of performance-related logs—counter logs and trace logs—and an alerting function. The following list describes these new or enhanced tools:
- Performance Logs and Alerts replaces Performance Data Log in the Windows NT Server 4.0 Resource Kit. As a result, data collection occurs regardless of whether any user is logged on to the computer.
- In Windows 2000, counter logs record sampled data about hardware resources and system services based on performance objects and counters in the same manner as System Monitor. When a counter log has been started, the Performance Logs and Alerts service obtains data from the system when the update interval has elapsed.
- Trace logs collect event traces that measure performance statistics associated with events such as disk and file I/O, page faults, or thread activity. When the event occurs, a data provider designed to track these events sends the data to the Performance Logs and Alerts service. The data is measured from start to finish, rather than sampled in the manner of System Monitor. The built-in Windows 2000 kernel trace data provider supports tracing system data; if other data providers are available, developers can configure logs with those providers as appropriate. A parsing tool is required to interpret the trace log output. Developers can create such a tool using APIs provided in the Platform Software Development Kit.
- With the alerting function, you can define a counter value that will trigger actions such as sending a network message, running a program, or starting a log. Alerts are useful if you are not actively monitoring a particular counter threshold value but want to be notified when it exceeds or falls below a specified value so that you can investigate and determine the cause of the change. You might want to set alerts based on established performance baseline values for your system. For information about establishing a baseline, see "Starting Your Monitoring Routine" later in this chapter.
- Viewing logged data is easier and more convenient. Counter logs can be viewed in System Monitor as they are collecting data as well as after data collection has stopped. Data in counter logs can be saved as comma-separated or tab-separated files that are easily viewed with Excel.
- Logs can be circular—that is, recording data until they achieve a user-defined size limit and then starting over. Alternatively, linear logs collect data according to user-defined parameters such as: run for a specified length of time, stop when that parameter is met, and start a new log. A binary file format can also be defined for logging intermittent data (such as for a process that is not running when you start the log but that begins and ends during the logged interval).
- You can save log settings to an HTML file or you can import settings from an HTML page to create new logs. When exported, the resulting HTML page hosts the System Monitor control, an ActiveX control that provides the performance monitoring user interface. If you open this page, you can dynamically observe, from a System Monitor view, the same counters you configured in the log. When imported, a new log or alert is created, based on the settings in the HTML page. This is a convenient way to insert the same settings into both a log and an alert, if appropriate.
- Configuring logs and alerts is flexible and easy to manage. Users can manage multiple logging sessions from a single console window. For each log, users can start and stop logging either manually, on demand, or automatically, at scheduled times or based on the elapsed time or the current file size. Users can also specify automatic naming schemes and stipulate that a program be run when a log is stopped.
Starting Performance Logs and Alerts
In Windows 2000 Professional, the Performance Logs and Alerts component is available in the Performance console and in the Computer Management console. The following procedures describe how to open the component from these locations.

Note
This procedure assumes that you have added the Administrative Tools option to your Programs menu as described in "System Monitor" earlier in this chapter.
To start Performance Logs and Alerts from the Performance console
- Click Start, point to Programs, and then click Administrative Tools.
- Click Performance.
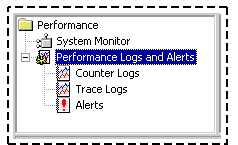
- Double-click Performance Logs and Alerts to display the available tools.

Enlarge figure
Figure 5.6 Performance Logs and Alerts Console Tree
Working with Logs and Alerts
To begin configuring logs and alerts, click the name of the tool to select it. If any logs or alerts have previously been defined, they will appear in the appropriate node of the details pane. A sample settings file for a counter log named System Overview is included with Windows 2000. You can use this file to see some basic system data such as memory, disk, and processor activity. For information about the types of data to monitor in your own configuration, see "Starting Your Monitoring Routine" later in this chapter.
Right-click in the details pane to create a new log or alert. You can do this in a new file or you can use settings from an existing HTML file as a template.

Note
You must have Full Control access to a subkey in the registry in order to create or modify a log configuration. (The subkey is HKEY_CURRENT_MACHINE\SYSTEM
\CurrentControlSet\Services\SysmonLog\Log_Queries.) In general, administrators have this access by default. Administrators can grant access to users by using the Security menu in Regedt32.exe. To run the Performance Logs and Alerts service, you must have the right to start or otherwise configure services on the system. Administrators have this right by default and can grant it to users by using Group Policy. For information about starting and using Group Policy, see Windows 2000 Server Help.
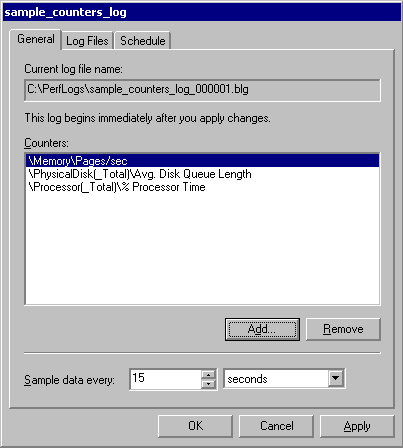
You are prompted to name your log or alert and then to define properties. Figure 5.7 is an illustration of the General properties tab for a counter log.

Enlarge figure
Figure 5.7 General Properties Tab for a Counter Log
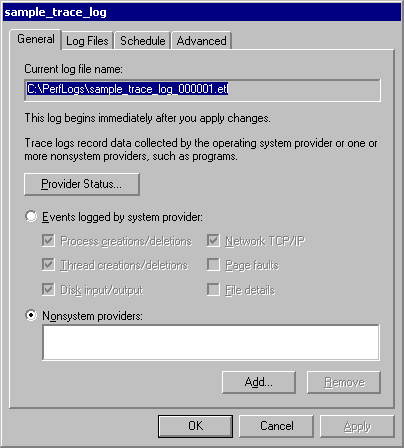
If you are configuring a counter log or an alert, use the Add Counters dialog box to specify objects, counters, instances, and updating. If you are configuring a trace log, use the General property tab shown in Figure 5.8.

Enlarge figure
Figure 5.8 General Properties Tab for Trace Log
Each tool offers some unique properties. The ability to configure scheduling is common to logs and alerts, but some options might not be available for all tools. Table 5.3 describes the options available in each tool and the property tab to use to configure it.
Table 5.3 Summary of Log and Alert Properties
| For this feature | Use this tab | To configure these settings | Notes |
|---|---|---|---|
| Alerts | General | Counters, sample interval, alert threshold, and alert comment | |
| Action | Actions to take when an event occurs | Examples of actions for an alert include running a program, sending a message, starting a counter log, and updating the event log. | |
| Schedule | Start and stop parameters for alerts | Automated restart is not available if you configure the alert to stop manually. You might need to update the Performance Logs and Alerts service properties if you opt to run a program that displays to the screen after the system triggers an alert. Use Services under Services and Applications in Computer Management for this purpose. | |
| Counter Logs | General | Counter log counters and sample interval | |
| Log Files | File type, file size limits, path and name, and automatic naming parameters | Counter logs can be defined as comma-separated or tab-separated text files, or as binary linear or circular files. | |
| Schedule | Manual or automated start and stop methods and schedule | Counter logs can be defined as comma-separated or tab-separated text files, or as binary linear or circular files. You can specify that the log stop when the log file is full. You cannot configure the service to automatically restart or to run a program if a log is configured to stop manually. You cannot configure a log to stop when full if the file is configured on the Log Files tab to grow to a maximum size limit. | |
| Trace Logs | General | Trace log providers and events to log | You cannot configure the service to automatically restart if a log is configured to stop manually. You can have only one system trace log running at a time. You cannot enable multiple providers simultaneously. To obtain disk input/output data from the system provider, you must also select File details. |
| Log Files | Trace log comment, file type, path and name, and automatic naming parameters | Only two types of trace logs are available: circular and sequential. | |
| Schedule | Start and stop parameters for a trace log | You cannot configure the service to automatically restart or to run a program if a log is configured to stop manually. | |
| Advanced | Trace log buffer size, limits, and transfer interval (periodic flushing) |
To start or stop a log or alert, right-click the name in the Performance Logs and Alerts window, point to All Tasks, and then click Start or Stop.
Getting the Most from Performance Logs and Alerts
Windows 2000 Server online Help for Performance Logs and Alerts describes performing the most common tasks with logs and alerts. The following list provides some additional hints about using the tools effectively:
- Export log data to a spreadsheet for reporting purposes. Importing log data into a spreadsheet program such as Excel offers benefits, such as easy sorting and filtering of data. To format the data for easy export, configure the log file type as Text File-CSV or Text File-TSV on the Log Files properties tab.
- Record transient data in a log. Not all counter log file formats can accommodate data that is not persistent throughout the duration of the log. If you want to record intermittent data such as a process that starts after you start the log, select the binary linear or circular file format on the Log Files tab.
- Limit log file size to avoid disk-space problems. If you choose automated counter logging with no scheduled stop time, the file will grow to the maximum size allowed based on available space on your disk up to 2GB (the largest log file that System Monitor can read). Trace logs have no file-size limit. When setting this option, take into consideration your available disk space and any disk quotas that are in place. Change the file path from the default (the Perflogs folder on the local computer) to a location with adequate space if appropriate. An error might occur if your disk runs out of disk space due to logging.
- Name files for easy identification. Use File name and End file names with on the Files properties tab to make it easy to find specific log files. For example, if you set up periodic logging, such as a log for every day of the week, you can develop different naming schemes with the base name being the computer where the log was run, or the type of data being logged, followed by the date as the suffix. For example, you could have a scheme that generates a file named ServerRed1_050212.blg, meaning it was created on a computer named ServerRed1 at noon, assuming the End file name with entry was set at mmddhh.
- Determine what trace data providers are available for trace logging. On the General properties tab, click Provider Status to see all data providers that have been installed. To see only enabled (running) data providers, click the Show only enabled providers check box in the Provider Status dialog box. For more information about WMI data providers, see the WMI SDK documentation in the MSDN Library at http://windows.microsoft.com/windows2000/reskit/webresources. You can only have one instance of each provider running at the same time.
© 1985-2000 Microsoft Corporation. All rights reserved.