Lesson 1: The Data Warehousing Analysis Process
As the data warehousing analysis process works from top to bottom, the resolution of the information goes from high level to detailed, and the focus goes from business to technical. In this lesson, you will work through the steps of the data warehousing analysis process.
After this lesson, you will be able to:
- Differentiate between typical objectives in operational and analytical systems
- Describe and detail the steps involved in analyzing and implementing data warehousing
Estimated lesson time: 50 minutes
Comparison of System Architectures
The information landscape is made up of several types of systems, each with a specific perspective. Systems generally fall into categories based on their configuration and the functions that they provide to the enterprise.
Operational Systems
Operational systems are dedicated to tracking individual events or making tactical decisions. Examples of operational systems include:
- Order tracking applications, such as catalog sales
- Customer service applications, such as setting up customer accounts
- Point-of-sale applications, such as a grocery store checkout
- Service-based sales applications, such as cellular telephone usage billing
- Banking functions, such as deposits and withdrawals
Operational systems most often show a point-in-time view of the business and handle a large number of transactions. Many source systems can be considered operational systems. Operational systems examine the current state of some predetermined combined set of events, potentially across multiple processes. Figure 3.1 shows how the operational system processes satisfy the objective of reporting the state of a system: An inquiry evaluates information about the status of the system and the status is returned as the result of that inquiry.
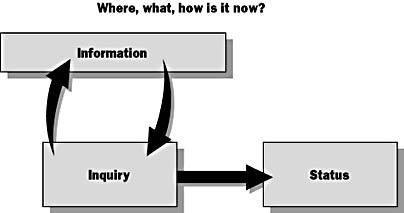
Figure 3.1 Operational system processes
For example, an operational system for a bank:
- Determines the current status of a specific order
- Determines the balance in a checking account as of a specific night s posting
- Determines if a customer who was opening a money market account had other accounts with the bank
Operational systems have the following characteristics:
- They are interested only in specific views of the world as it exists at that point in time.
- They are highly volatile due to the consistent change stemming from business operations.
- They are concerned with the capture, specification, and modeling of events, regardless of the methodology employed (object oriented, information engineering, or other).
Analytical Systems
Analytical systems provide information about multiple events. This information is used to drive strategic decision making. Examples of analytical systems include:
- Sales forecasting applications, such as using spreadsheets created from sales data stored in transactional and operational systems
- Executive information systems (EIS)
- Data mining systems, which have tools that expose patterns in data
- Online analytical processing
Figure 3.2 shows the objectives that characterize analytical system processes.
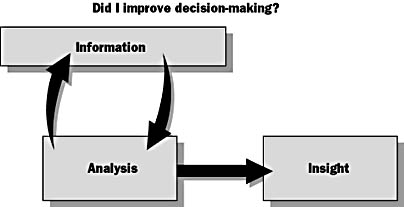
Figure 3.2 Analytical system processes
Analytical systems have the following characteristics:
- They examine events and their results over time in order to provide the business with some insight.
- They do not trace the process of any single event.
- Compared with transactional and operational systems, they are not well defined and are therefore potentially vague.
- They comprise multiple data sources.
When building an analytical system such as a data warehouse, you develop a system that must support some undefined or changing requirements over time. The higher the degree of changing requirements, the harder your success (or failure) is to measure. This lack of a finite definition is one of the major challenges in a data warehousing project. Maintaining focus on exactly what the business wants to accomplish can become difficult if this is not controlled.
It is critical that you correctly identify your business requirements. Analytical systems fulfill those requirements only if the decision-making process is improved.
Is It Operational or Is It Analytical?
In many organizations, the distinction between system perspectives can be blurred. For example, an integrated mail-order application may exhibit characteristics of an operational system (order entry, customer set-up, and account/order status) as well as some analytical characteristics (distribution by zip code, volume by month, and cost by format).
Comparing the Systems
Operational systems deal with individual events, while analytical systems deal with multiple events and situations over time, as shown in the following table.
| Operational Systems | Analytical Systems |
|---|---|
| Detect an event | Measure many different events |
| Respond to the event | Measure the responses of the system to the events |
| Inquire about the status of the event | Evaluate relationships between events, after the fact, on a large scale |
Analytical systems provide insight into ways to improve responses and elicit more desirable events from the environment; essentially, they show how to improve the processes, services, and product offerings of a business. Because analytical systems are potentially less clearly defined than operational systems, it is important to define your system specifications as completely as possible.
Business Analysis
It is important to emphasize the business side of data warehousing. It is too easy to get caught up in the implementation details before the full business case is understood. The first direction any data warehousing effort should take is to understand why an organization may benefit from better use of analytical systems. Figure 3.3 illustrates the steps in this process. The rest of this lesson discusses these steps in detail.
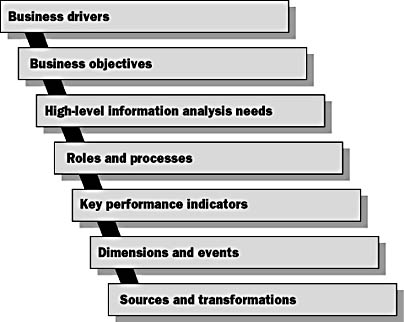
Figure 3.3 The data warehousing analysis process
Business Drivers
What factors affect the company? Business drivers are principal factors in determining what, when, and how strategic decisions are made. Once you understand how external forces affect the company, you can design a system that provides information that enables management to make decisions on how to respond to these forces.
By examining the external forces that affect (or drive) the business, you will begin to develop a high-level understanding of the business requirements. These external forces include:
- Entrance of new competitors changing pricing and market share
- New customers increase in volume
- Changes in government implications regulation, deregulation, mandates, and incentives
- Development of new products and services changes in processes, procedures, and responsibilities
Business Objectives
A business objective is a clearly defined goal that will increase or retain opportunities. In response to external drivers, management establishes business objectives, such as:
- Increase sales through better targeting
- Decrease costs through identifying nonvalued services
- Leverage opportunities for cross-selling by increasing awareness of the market and common cross-selling opportunities
- Increase customer satisfaction and retention
- Provide metrics to increase productivity of the value chain
Understanding these external drivers and the objectives set in place to respond to them will give you the context, priority, and initial scope of your data warehouse design effort.
High-Level Information Analysis Needs
After you identify the needs of a business, begin the initial collection of information. You will use this information, which is general and summary in nature, to paint a clearer picture of the business processes that your particular client uses to gather and disseminate information.
Hold a Business Definition Session
Use these sessions with senior management from various business units across the enterprise to:
- Collect business drivers and objectives to establish what analytical needs exist
- Identify corresponding business subject areas to assist in establishing the focus of the initial iteration
- Identify high-level processes and key performance indicators (KPIs) to determine what will be modeled in the initial iteration
Documentation is collected throughout the entire process. During this phase, the focus is on enterprise-level materials, which, along with the sessions, enable an accurate assessment. As information about the process is developed, planning can be taken to a more detailed level.
Continuous management involvement is critical to the development of a data warehouse because it helps to:
- Identify information gaps—These represent business analytical needs that cannot be fulfilled by current operational processes.
- Identify roles of principal business analysts and decision-making personnel—These are used to select participants for the interviewing activity in the next phase. In other words, what do the personnel do, and how do they do it?
Hold an Information Technology Environmental Review Session
Use these sessions with senior management from the IT group to:
- Review information technology (IT) infrastructure—This represents the platforms, operating environments, and connectivity that form the home for existing applications.
- Review strategic or tactical plans in place to address existing and planned business objectives—These represent the future of the IT infrastructure.
- Identify any limitations and constraints—These represent barriers that must be addressed before a data warehouse is implemented.
The information collected during this phase takes the form of enterprise-level documentation and facilitated session notes. The analysis of this information results in findings and recommendations in the form of an assessment.
Collect and Review Enterprise Documentation
Collect and review documentation to gather and analyze client business and IT planning and infrastructure documentation. This information is typically requested prior to the actual start of the process. It provides the team with a baseline understanding that optimizes session effectiveness.
Look for the following documentation from your client:
- Enterprise or subject area models—Enterprise models depict the system and entity relationships across the entire enterprise, whereas subject area models encompass only a given subject area or business process, such as sales or shipping. During this phase, an enterprise model is preferable. If only business area models are available, request as many as possible to enable an enterprise view.
- Enterprise organization chart—This should include documented roles and responsibilities that are essential to putting things into context.
- Source context diagrams—These provide a high-level (entity) view of the existing systems and are used to identify gaps in the information needed by the business.
- Network overview—This illustrates how the systems are sewn together and is useful in determining the difficulty in getting at data.
Analyze and Assess Information
In order to zero in on the information that will prove most useful for identifying data warehouse objectives, consider the following aspects of your particular client s business:
- Prioritize the business requirements—This aspect involves compiling the following elements and prioritizing the analytical needs that a data warehouse might satisfy as viewed by the business:
- Analytical roles
- Key analytical processes
- Key high-level objects, data life cycles, and relationships
- Select the subject area for the initial iteration of the data warehouse—This involves taking the prioritized needs and determining what subject area (or areas) would provide the greatest business value in the initial data warehouse iteration. It is critical that the scope of the initial iteration be kept a small as possible.
- Identify technical, business, and organizational constraints—This aspect involves identifying all issues that may impact the implementation of the initial iteration. These include time, money, resources, data quality, data availability, politics, sponsorship, and ownership.
- Calculate the return on investment (ROI) based on preliminary cost and benefit estimate—This involves estimating the cost of hardware, software, and labor to build and maintain the data warehouse. If possible, limit the cost estimates to the initial iteration; all potential benefits should be considered, even those that may not be realized immediately. Data warehouses often provide benefits that are unknown or difficult to quantify when they are considered during the initial design phase. Strong justification for return on investment contributes to the viability of the data warehousing project.
Develop a Project Plan for the Requirements Definition and Architecture Analysis Phase
You develop a project plan to:
- Plan discovery and analysis. The magnitude of the effort to define the detailed requirements is based on the perceived size and complexity of the subject area.
- Resolve activity-level time and resource estimates. The resulting plan includes what detailed activities (tasks) are necessary, how much time each activity should take, what resources (for both the business and project team) are required, and the interdependence among the activities.
Having defined the scope of the initial iteration, you can develop a project plan for the next phase of the process and a management checkpoint.
Identifying and Prioritizing Analysis Techniques
Once you have defined the business objectives, it is a fairly simple task to identify the analyses needed to support them. It is then up to management (with the help of the project team) to establish priorities for these analyses and select those that will be included in the initial iteration of the data warehouse.
With any data warehouse project there exists an ideal amount of preparation:
- Too much preparation can prevent the project from commencing or allow the nature of the business needs to change by the time the warehouse is implemented.
- Too little preparation can result in a warehouse that does not provide the necessary benefits or that does not include essential facts in the first iteration.
The ideal is to engage in a thorough enough analysis that one can feel confident about the first iteration of the warehouse but not so much that the implementation never occurs. The best way to assess the correct amount of preparation is to decide on which objectives the first iteration of the data warehouse will serve.
The following table illustrates how a specific client may prioritize various analyses.
| Analysis Description | Low | Medium | High |
|---|---|---|---|
| Sales | X | ||
| Customers | X | ||
| Competitors | X | ||
| Product movement | X | ||
| Store, department, category, and product mix | X | ||
| Promotion | X | ||
| Labor resource | X | ||
| Gross profit/margin | X |
By selecting only those items that fall into the high-priority column, you limit, and therefore make more manageable, the scope of the data warehouse project. Of course, if you can include other priority items without greatly increasing the scope of the project, it makes sense to do so.
First Management Checkpoint
When you have completed the information-gathering phase, it is time to ensure that you are on the right track before beginning the identification of roles and processes.
Include Business Sponsors, Client Project Managers, and Key Stakeholders
Participation by business sponsors, client project managers, and key stakeholders is essential to project success; the data warehouse must sell itself to management at every opportunity.
Review and Approve Phase Deliverables
During the review and approval process, the project team gets to show its wares and gauge the reaction of management. It is possible that some reworking will be necessary and an additional checkpoint scheduled.
Identify and Discuss Open Issues
When the open issues are identified and discussed, management has its turn to ask questions. The project team should acknowledge all known issues and be ready to receive additional ones from management. A log of open issues (updated with current status) should be maintained by the project team lead.
Review and Approve Project Plans for the Next Phase
Reviewing and approving project plans for the next phase should be a mere formality. However, the team must be prepared to discuss and, if necessary, justify timings and resource requirements. A well-crafted plan should stand up to close scrutiny.
Roles and Processes
After the first management checkpoint, you must identify the roles and processes involved with the business. Conduct interviews with business analysts for their insight on important measurements. Do not overlook the opportunity to conduct interviews with subject matter experts at all levels of the enterprise.
Identifying Roles of Players in the Analysis
By identifying all the potential players who have anything (however remote) to do with your chosen analysis area, you ensure that you get an enterprise perspective. For each role, identify those individuals who represent the needs of that role. Figure 3.4 shows the different individuals that might play a part in a sales data warehouse.
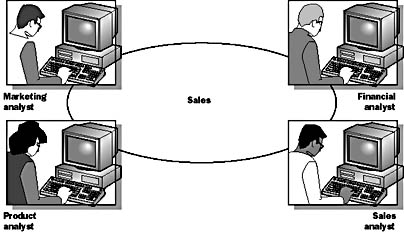
Figure 3.4 Different roles in a subject area
In the following scenario, assume that you are working with a company that has a chain of convenience stores. The stores have begun to expand their product offerings, and it has become difficult for buyers to keep up. In response to buyers feedback, the corporation has decided to institute a category management program for products. The product analyst has been tasked with analyzing product movement, sales analysis over time, and profit margin analysis.
Once individuals activities have been characterized, interviewees are asked to get more specific about their role by identifying distinct analysis processes/needs. These are then reconciled against the initial prioritized business objectives established in the opportunity evaluation phase.
Figure 3.5 shows that the product analyst is tasked with providing the category managers with historical sales analysis to better manage sales and inventory performance. By analyzing the product movement, the category managers can ensure that they are stocking and merchandising the right product mix at the right time, thereby reducing inventory costs and maximizing profit margins. This information can then be used for strategic product planning, buying, and delivery.
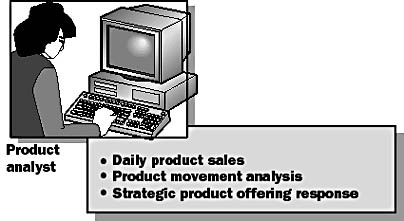
Figure 3.5 Identifying role analysis processes
Understanding Role Information Requirements
It is often easier to understand each analysis and its underlying information requirements when the analysis is phrased as a question. As the interviewee explains each analysis, a specific question for that analysis is developed. For example,
"How many bags of our product, by size, by flavor, were sold each month this year, in the Eastern division, by store, broken down by store size, compared to the same month last year?"
In the above example, the product movement analysis is expressed as a comparative evaluation of a brand and type of snack food in a specific area over time.
Key Performance Indicators
The business analysis and interview phases produce a list of key performance indicators (KPIs).
- Number of units sold
- Sales revenue
- Product gross profit
You need to map out the interaction and elements of the business process. Figure 3.6 is one example of how to diagram such a business process.
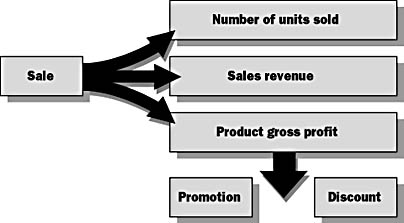
Figure 3.6 Identifying key performance indicators
This figure shows what the KPIs are and reveals the previously unidentified discount and promotion KPIs.
Information Objects and Events
Information objects are persistent entities that have attributes, which are changed by events. For example, a product (information object) is placed on back-order (event), then it is restocked (event), and finally, it is shipped (event).
Identifying Information Objects and Events
You decide that you must keep track of product movement in each store on a daily basis. Each store has a point-of-sale (POS) register that is networked to a central server for all the stores.
Figure 3.7 illustrates the information objects, which are:
- Time, tracked by day—within a week, month, quarter, and year
- Product, tracked by stock keeping unit (SKU)— within size, package, and brand
- Organization, tracked by store—within market, region, area, and division
Figure 3.7 illustrates the events, which are:
- Stock—bringing product into the store
- Sale—delivering the product to a customer and collecting revenue
- Reorder—requesting replenishment for sold product
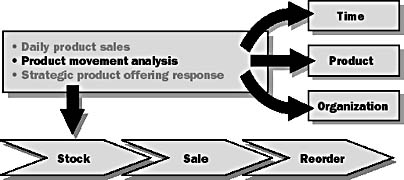
Figure 3.7 Identifying information objects and events
Exercise 1: Identifying Information Objects, Events, and Key Performance Indicators
In this exercise, you will examine the text from a sample interview and extract the pertinent information objects, events, and key performance indicators.
Scenario
The following is an excerpt from the transcript of an interview with a product analyst:
Interviewer: Describe the product sales analysis that you do.
Analyst: I look at a number of reports and identify trends and significant changes in the normal monthly product activity by our customers.
Interviewer: Describe the activity for a customer.
Analyst: Our employees (salespeople) take orders from customers and send them to the company by fax and telephone. The data entry staff will take orders from customers, enter each product ordered, and figure the total. The customer will be shipped the order by one of our shipping companies.
Interviewer: What metrics do you use to evaluate sales?
Analyst: Units sold, sales revenue, and product gross profit.
Interviewer: How do you calculate product gross profit?
Analyst: We take the product unit price and multiply by the number of units sold. Then we subtract any discounts granted to customers on a particular product purchase. The freight will then be calculated and added to the amount.
Interviewer: How does the customer get these discounts?
Analyst: The discounts are given to a customer as a promotional campaign for a group of products.
Interviewer: How do you determine trends?
Analyst: I look at activity from month to month and from one month in a year to the same month in the previous year.
Interviewer: How about these significant changes that you mentioned?
Analyst: I look at how a product is selling in a given month to one customer compared to all the other customers in the region or state. For example, in the U.S., the regions are the actual states. Because we sell to many countries, the geographical equivalent of a state is a region. So, I can also compare the total activity across cities within regions and countries for a product.
- To identify information objects
- Identify nouns that imply a classification, grouping, or primitive measurement (such as vendor, department, or quantity).
- Convert the noun to singular. Generalize, if necessary.
- To identify events
- Identify verbs that imply a procedure (such as receive, transfer, and deposit).
- Convert the verbs to present tense. Combine verbs with similar meanings.
- To identify key performance indicators
- Review the interview to identify key performance indicators.
List the nouns that were converted.
Answers
List the verbs that were converted.
Answers
List the nouns or noun pairs that imply a process measurement (such as liquidity index, ROI, and breakeven point).
Answers
Evaluating Current Management Reports
Current management reports provide a wealth of information about the analytical requirements of the business. Use the current management reports to test whether the information objects and events that you have identified completely cover the business analysis needs. Figure 3.8 shows an example of a current management report that includes facts, dimensions, and hierarchies, which you will learn to identify in the following topic. This typical example of a management report contains sales volumes for several cities over a three-month period. Evaluating this report uncovers the following:
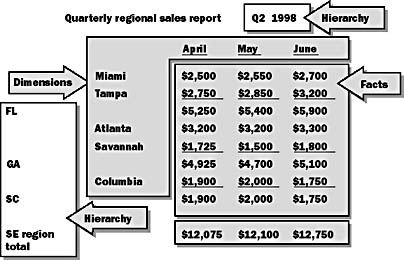
Figure 3.8 Evaluating current management reports
- Sales volume is expressed in whole dollars—fact.
- Sales volume is tracked by city—dimension.
- Cities roll up into states, and states roll up into regions—hierarchy.
- Sales volume is recorded by month—dimension.
- Months roll up into quarters, and quarters roll up into years—hierarchy.
Dimensions and Events
Identifying dimensions and events can be broken down into two tasks. The first task is choosing the measures. A fact represents the measures that are recorded for each occurrence of an event. Examples of measures are:
- Order quantity
- Dollar value
- Inventory count
Each combination of dimensions and facts represents a measurable business requirement.
As the relationships between roles, processes, and information are discovered, the common points among these three components must be understood. This understanding provides the basis for a conceptual data model, or usage diagram. Without a clear understanding of these common points, it is unlikely that the conceptual data model will be scalable across the enterprise. Figure 3.9 shows how analysis can provide a conceptual model that scales across the enterprise. The arrows in this figure represent the events, such as the sale of a product.
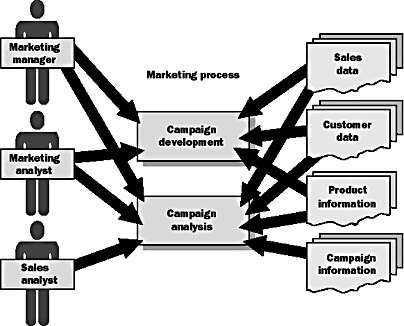
Figure 3.9 Looking for common points between roles, processes, and information
The second task is choosing the dimensions, defined as the entities (and their associated hierarchy) with which events interact. Examples of dimensions are:
- Customers
- Time
- Product
- Status
Exercise 2: Identifying Dimensions, Facts, and Hierarchies
In this exercise, you will examine a sample management report and extract the pertinent dimensions, facts, and hierarchies. During an interview with the product analyst, you were provided with a report that the product analyst uses to track monthly product units sold for a specific geographical location. The report is shown in Figure 3.10:
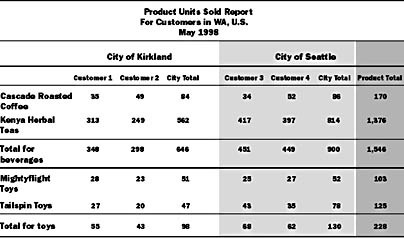
Figure 3.10 Sample management report
- To identify dimensions
- Review the report and provide answers.
- To identify facts
- Review the table and provide an answer.
- To identify hierarchies for the dimensions
- Review the table and provide answers.
List the lowest-level dimension for the column headings.
List the lowest-level dimension for the column headings.
List the dimensions in the report heading
Answers
List the intersection of the lowest-level dimension column and row headings.
Answers
List all aggregated column headings.
List all aggregated row headings.
List all higher-level hierarchies in the report heading for the Time dimension.
Answers
Sources and Transformations
At this point you have developed a good conceptual model of your data warehouse. You know what information the warehouse must provide. The final step is to identify where the information will come from and what you must do to it to make it suitable for the data warehouse. You should choose data that provides immediate realization of value. Simplify the requirements for extracting data by:
- Choosing the most accessible data sources available
- Choosing data with the highest degree of data integrity
- Limiting the risk and complexity involved in extracting from multiple sources
After identifying the data sources, you perform transformations when moving data from the data sources to the data warehousing system. Data sources and transformations are important components early in the data warehousing life cycle.
Figure 3.11 shows data sources and transformations in the data warehousing life cycle.
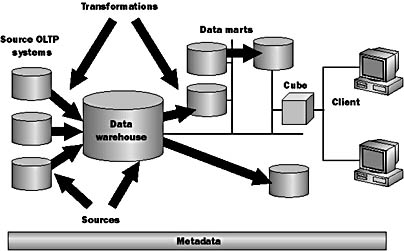
Figure 3.11 Sources and transformations
The data sources shown in Figure 3.11 are:
- Source online transaction processing (OLTP) systems.
- Data warehouse. This is the consolidated database upon which analysis is performed or that is used as a basis for moving data to departmental data marts. In some data warehouses, the marts will be the sources and will be combined into an enterprise data warehouse.
These are operational systems that are used to run the business.
Transformations can take place any time that data is moved between two points.
- From the source OLTP systems to the OLAP data warehouse, you will extract, cleanse, and load data.
- The data warehouse may serve as the starting point for extraction into departmental data marts.
Documentation
Deliverables from this step in the process are:
- Source context diagrams, which are conceptual diagrams that focus on relationships between the data from different systems.
- Documentation of data life cycles, which includes periodicity, expected volumes, and data sources
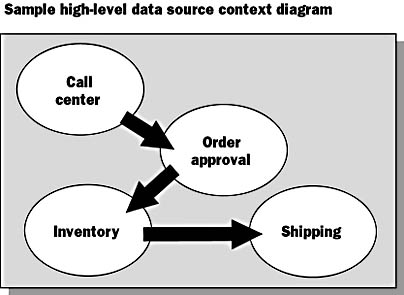
Figure 3.12 High-level source context diagram
Lesson Summary
Data warehouse analysis has some unique challenges:
- Unlike with operational systems, the scope of the data warehouse project often encompasses multiple computer environments and organizational divisions.
- Unlike operational systems, the data warehouse often depends on multiple input systems. These systems may not be coordinated or interoperable. They may not interact at all.
- An effective data warehouse implementation will provide benefits that were not foreseeable during design. For example, an organization will discover a new correlation between business lines that provides an opportunity for cross-selling and increased sales. This is apparent only after the data warehouse is implemented.
The broad scope, multiple dependencies, and fuzzy goal line make analysis essential. Thorough analysis provides a clear starting point for conceptual design and a clear mandate for the data warehouse project.
The success of the requirements gathering process rests with the following:
- Taking an enterprise perspective
- Applying a business context
- Using interviews to collect detailed requirements
- Returning results from sessions and interviews
- Involving the users in the process
Take an Enterprise Perspective
Involve as much of the business sector as possible. The true value of the data warehouse is fully realized when it is extended across the enterprise. Because the intent is to build an enterprise data warehouse incrementally, even those business areas that will not be involved in the early iterations feel that they are part of the process and will eventually receive benefit.
Apply a Business Context
The intent of the data warehouse is to build business value through insight from information. This requires that it start with the business and move to the technology, not the other way around.
Use Interviews to Collect Detailed Requirements
Interviews with management and analysts from within the initial iteration subject area are used to collect the information necessary to develop a conceptual model for the iteration. Interviews with the staff that are experts regarding the subject matter in the legacy application and with the managers of the network infrastructure are used to collect information on how to implement the data warehouse environment and populate the database. Issues, concerns, and constraints that might affect the success of the project are collected from all interviewees.
Return Results from Sessions and Interviews
The information collected during the sessions and interviews must be reviewed with the source. This does two things: It ensures that the information was collected accurately and that no invalid assumptions have been made, and it provides an opportunity to reinforce the lines of communication with management and users.
Involve the Users in the Process
Ultimately, the users will decide the success (or failure) of the data warehouse. Involve them as early as possible and maintain contact with them throughout the process. Periodic status meetings and progress reports are two good ways to keep users in the loop. Involving users provides two significant benefits:
- It ensures the business requirements you gather are field-tested and accurate.
- It makes users part of the warehouse building team, which increases the likelihood of their accepting and using the warehouse.
EAN: 2147483647
Pages: 114
- Chapter I e-Search: A Conceptual Framework of Online Consumer Behavior
- Chapter III Two Models of Online Patronage: Why Do Consumers Shop on the Internet?
- Chapter VI Web Site Quality and Usability in E-Commerce
- Chapter XVI Turning Web Surfers into Loyal Customers: Cognitive Lock-In Through Interface Design and Web Site Usability
- Chapter XVIII Web Systems Design, Litigation, and Online Consumer Behavior