Tool 147: Process Capability Ratios
| AKA | Capability Indices |
| Classification | Analyzing/Trending (AT) |
Tool description
Process capability ratios are calculated to determine the process variation that comes from natural or special causes. These ratios, also called Cp and Cpk Indices, relate the process variability to the design specification (tolerance) that reflects the customer's expectation or requirements. Cp is listed to characterize the capability, and Cpk is used to measure actual process performance.
Typical application
-
To estimate how well the process meets customer requirements.
-
To monitor and measure product quality.
-
To verify process variability to design specifications.
-
To promote communications among design engineering, suppliers, and manufacturing.
Problem-solving phase
| → | Select and define problem or opportunity |
| → | Identify and analyze causes or potential change |
| Develop and plan possible solutions or change | |
| Implement and evaluate solution or change | |
| → | Measure and report solution or change results |
| Recognize and reward team efforts |
Typically used by
| Research/statistics | |
| Creativity/innovation | |
| 1 | Engineering |
| Project management | |
| 2 | Manufacturing |
| Marketing/sales | |
| Administration/documentation | |
| Servicing/support | |
| 3 | Customer/quality metrics |
| 4 | Change management |
before
-
Standard Deviation
-
Sampling Methods
-
Descriptive Statistics
-
Normal Probability Distribution
-
Control Chart
after
-
Variance Analysis
-
Process Flowchart
-
Process Analysis
-
Activity analysis
-
Basili Data Collection Method
Notes and key points
-
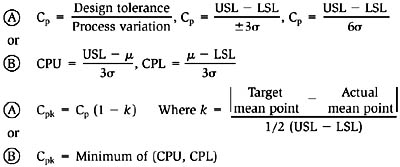
Definitions of process capability ratios:
-
Cp: A measure of ideal or potential process capability. The Cp index reflects the best ability of a process to perform within lower and upper design specification limits (LSL ⃡ USL).
-
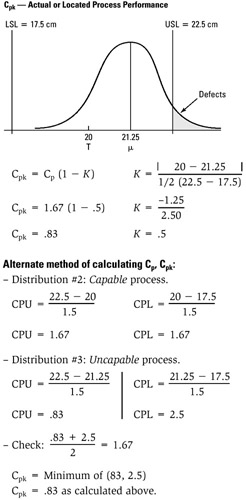
Cpk: A measure of actual or located process performance. The Cpk index reflects the actual, located process mean relative to the design target value.
-
CPU: Upper process capability
-
CPL: Lower process capability
-
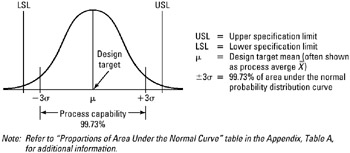
μ or
 : Process average
 -
Equations for calculating Cp and Cpk:
-
Process capability:
-
Step-by-step procedure
-
STEP 1 A team is formed with the goal of reduced process variability.
-
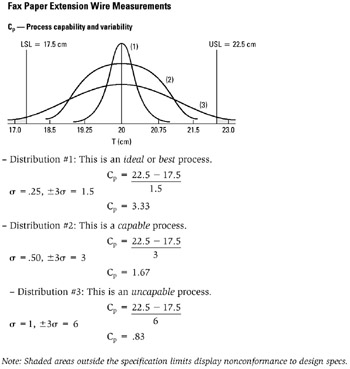
STEP 2 Through the data collection process, process data such as specific product specifications tolerances, control charts, samples of measurements, and historical data calculations, are acquired. See example Fax Paper Extension Wire Measurements.
-
STEP 3 Sample data are organized and summarized using descriptive statistics. A recommendation is made to read some background tools contained in this book:
-
Descriptive statistics (tool 66)
-
Normal probability distribution (tool 119)
-
Standard deviation (tool 184)
-
-
STEP 4 Using process means and standard deviations, the Cp capability ratios can be calculated and compared.
Note Measurement in this example is centimeters (cm).
-
STEP 5 An action plan is developed on the basis of the actual process performance results calculated. Required activities usually require reduction of process variations or recentering of the process within the specifications.
Example of tool application
Fax Paper Extension Wire Measurements
Cp—Process capability and variability
EAN: 2147483647
Pages: 326