Tool 104: Markov Analysis
| AKA | N/A |
| Classification | Analyzing/Trending (AT) |
Tool description
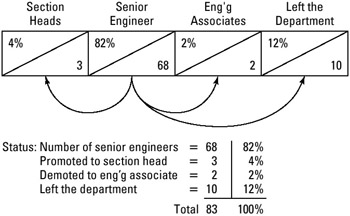
A Markov analysis is used to identify employee movement through the various positions within an organizational unit. A matrix displays the percentage of employees who stayed in their position, who were promoted or demoted, or who left the department or company. The analysis results provide valuable information for the forecasting and budgeting of personnel.
Typical application
-
To forecast staffing and training requirements.
-
To track the movement of personnel through the organization.
-
To identify patterns of job changes.
Problem-solving phase
| → | Select and define problem or opportunity |
| → | Identify and analyze causes or potential change |
| Develop and plan possible solutions or change | |
| Implement and evaluate solution or change | |
| → | Measure and report solution or change results |
| Recognize and reward team efforts |
Typically used by
| Research/statistics | |
| Creativity/innovation | |
| Engineering | |
| 1 | Project management |
| Manufacturing | |
| Marketing/sales | |
| 2 | Administration/documentation |
| Servicing/support | |
| Customer/quality metrics | |
| 3 | Change management |
before
-
Information Needs Analysis
-
Data Collection Strategy
-
Demographic Analysis
-
Task Analysis
-
Cluster Analysis
after
-
Problem Specification
-
Presentation
-
Cost-Benefit Analysis
-
Resource Requirements Matrix
-
Action Plan
Notes and key points
-
Typical employee movement
Step-by-step procedure
-
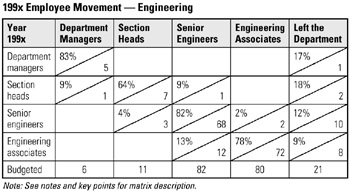
STEP 1 All personnel movement throughout the department or company is monitored and recorded for specific period of time. See example 1996 Employee Movement—Engineering.
-
STEP 2 A Markov analysis matrix is developed for a particular organizational unit, and the previously collected staff-change data is inserted into the matrix cells.
-
STEP 3 Percentages are computed, row totals are verified for accuracy, and original budget totals added.
-
STEP 4 The finalized matrix is dated and presented to organization's management.
Example of tool application
199x Employee Movement—Engineering
EAN: 2147483647
Pages: 326
- Challenging the Unpredictable: Changeable Order Management Systems
- The Second Wave ERP Market: An Australian Viewpoint
- Enterprise Application Integration: New Solutions for a Solved Problem or a Challenging Research Field?
- Context Management of ERP Processes in Virtual Communities
- Data Mining for Business Process Reengineering