Tool 65: Deployment Chart (Down-Across)
| AKA | N/A |
| Classification | Planning/Presenting (PP) |
Tool description
A deployment chart reflects the sequence of required activities and the persons or teams responsible for completing them. The chart's down-across construction also indicates approximately when, by due dates, these activities are scheduled to be completed.
Typical application
-
To provide a process or project overview of activities, people involved, activity sequence, and completion dates.
-
To illustrate a process flow for teams to refer to during problem-solving or process-improvement efforts.
Problem-solving phase
| Select and define problem or opportunity | |
| Identify and analyze causes or potential change | |
| → | Develop and plan possible solutions or change |
| → | Implement and evaluate solution or change |
| Measure and report solution or change results | |
| Recognize and reward team efforts |
Typically used by
| Research/statistics | |
| Creativity/innovation | |
| Engineering | |
| 1 | Project management |
| Manufacturing | |
| Marketing/sales | |
| 3 | Administration/documentation |
| Servicing/support | |
| Customer/quality metrics | |
| 2 | Change management |
before
-
Demographic Analysis
-
Consensus Decision Making
-
Circle response
-
Checklist
-
Problem Analysis
after
-
Action Plan
-
Resource Histogram
-
Project Planning Log
-
Events Log
-
Major Program Status
Notes and key points
-
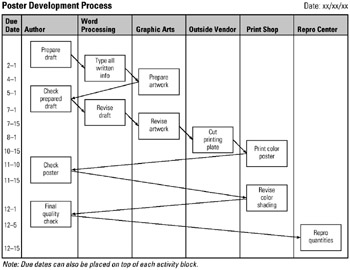
Deployment chart activities start at top-left of chart and move down-across. Due date (end of activity) is lined-up laterally with the bottom line of the activity box.
-
Optional: A due date column is not necessary if due dates are placed on top of respective activity box.
Step-by-step procedure
-
STEP 1 The facilitator draws an outline of a deployment chart (down-across) on a whiteboard. The process or project to be charted is reviewed and clarified.
-
STEP 2 Team participants brainstorm required activities. See example Poster Development Process.
-
STEP 3 With the assistance from the participants, activity blocks are drawn into the columns that reflect who or what group is performing this activity.
-
STEP 4 Activities are inserted from the top down and across to show directionality and elapsed time. Lines are drawn to sequentially link all activity blocks in a downward flow.
-
STEP 5 A column with due dates of respective activities is constructed as the last activity to complete the chart as shown.
-
STEP 6 The team reflects the process flow of the chart, makes any revisions, and dates the chart.
Example of tool application
Poster Development Process
EAN: 2147483647
Pages: 326