Tool 56: Cycle Time Flow Chart
| AKA | Process Cycle Time Analysis |
| Classification | Analyzing/Trending (AT) |
Tool description
A cycle time flowchart accounts for all activities and time required from the start point to the stop point of a process. The intent of using this tool is to identify non-value-adding activities, bottlenecks, excessive loops, approvals, and delays. The flowchart is constructed by a team that owns the process. Participants have a good understanding of the activities and therefore are best suited to collectively produce the cycle time of the overall process.
Typical application
-
To identify non-value-adding activities and excessive delay time in a process.
-
To capture the "as is" process flow in order to have better team understanding of the process for further problem-solving efforts.
-
To draw a detailed flowchart for the purpose of completing redesign, problem resolution, and cycle time reduction activities.
Problem-solving phase
| → | Select and define problem or opportunity |
| → | Identify and analyze causes or potential change |
| Develop and plan possible solutions or change | |
| Implement and evaluate solution or change | |
| Measure and report solution or change results | |
| Recognize and reward team efforts |
Typically used by
| Research/statistics | |
| Creativity/innovation | |
| Engineering | |
| 2 | Project management |
| 3 | Manufacturing |
| Marketing/sales | |
| Administration/documentation | |
| 4 | Servicing/support |
| Customer/quality metrics | |
| 1 | Change management |
before
-
Process Mapping
-
Problem Specification
-
Pareto Chart
-
Potential Problem Analysis (PPA)
-
Systems Analysis Diagram
after
-
Process Analysis
-
Problem Analysis
-
Activity analysis
-
What-If Analysis
-
Force Field Analysis (FFA)
Notes and key points
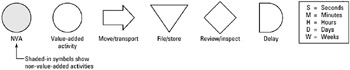
Symbols and scale:
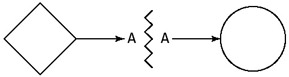
Connectors example
When stating an activity's cycle time, indicate (A) for actual time, (E) for estimated time.
Step-by-step procedure
-
STEP 1 The team facilitator assembles a team that consists of representatives (process owners) of the process to be the subject of the cycle time flowchart. A whiteboard is prepared to draft out the flowchart.
-
STEP 2 The team determines the start and stop points of the process. The appropriate scale of time to be used is also determined.
-
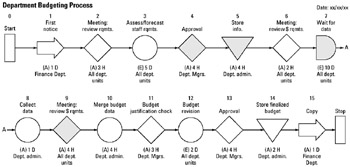
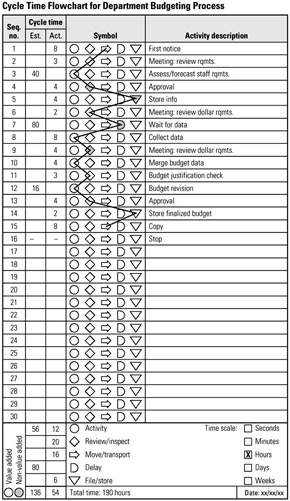
STEP 3 Using team-provided input, the team facilitator, using flowchart symbols, sequentially connects all activities in the process, showing sequence number, what is being done, who does it, and how much time is used to complete each activity. Time is stated as actual (A) or estimated (E). See example Department Budgeting Process.
-
STEP 4 Next, the team checks the charts for completeness, correct task sequence, and task-identifying information.
-
STEP 5 Finally, the completed cycle time flowchart on the whiteboard is copied onto the flowchart template and the information is summarized. The chart is dated and kept for cycle time reduction work.
Example of tool application
Department Budgeting Process
Cycle Time Flowchart for Department Budgeting Process
EAN: 2147483647
Pages: 326