Examples
The act of modeling an application using any methodology is not trivial. Software packages help you produce the symbols, but do not do the task of planning the application. Do not be concerned if you do not immediately know what to write. Whole courses and substantial textbooks are devoted to the systems analysis and systems design process. Techniques include study of the artifacts of any existing system, such as reports and input forms, and structured interviews with the people who will use the system.
State Capital Quiz Logical Design
In the last section, you read about an application involving orders. Let us now apply the same thought process to the state capital quiz, but we will step back before the quiz application was made. Note that this example was called a “mini” quiz because the data for the questions and answers was contained in a file as opposed to a database. The models that will emerge here will not indicate that characteristic.
Who are the potential agents for the mini-quiz?
-
The person taking the quiz. An appropriate name for this agent/person is “player.”
-
The person creating the questions and answers. The name for this agent is more problematical. Let us call him or her the editor for now.
The qualifier “potential” is a hint to you that we are hedging our comments.
What are the data stores for the quiz?
-
The set of questions and answers, namely the state and capital pairs.
What are the processes for the mini-quiz?
-
Taking the quiz
-
Preparing the questions
The process diagram based on this information is shown in Figure 6.3.
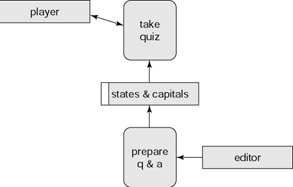
Figure 6.3: Process diagram for state capitals quiz.
State Capital Quiz Physical Design
This is the process diagram for the mini-quiz application on state capitals. However, let us now continue by moving from analysis to design. At this point, the systems analyst decides that the preparation and editing of the questions and answers will not be part of the application; that is, not be part of the application after the initial deployment. This does make sense since the set of states is fixed and, if it does change, it tends to be a slow process. The states/capitals data store will be implemented using two parallel arrays, stored in the code. It will be a static data store—no facilities for changes.
Continuing with the “planning out loud” of the implementation, the next step could be to expand the “take quiz” process. It could be appropriate to go straight to defining the scripts and recording those decisions in a storyboard. However, elaborating on the process diagram will reveal aspects of process diagrams that are important to understand.
The first step is to split the take quiz process into three tasks:
-
Indicate the choice of question
-
Be asked the question
-
Answer and have the question checked
Figure 6.4 is a first guess at a new, more detailed process diagram. It has flaws, which will be explained.
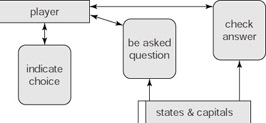
Figure 6.4: First draft of process diagram for state capital quiz.
What is missing? The indicate choice process actually stores the player’s choice (state or capital), and this needs to be stored somewhere. Similarly, the specific question chosen needs to be stored so that the check answer process knows how to check the answer. These are not large amounts of data, but what often is called state variables. However, the process diagram methodology is intended to capture this information. An aspect of the application that process diagrams do not convey is the sequence of steps. Another way to say this is that a process diagram does not show time or timing. For completeness sake, Figure 6.5 shows a correct version of the process diagram.
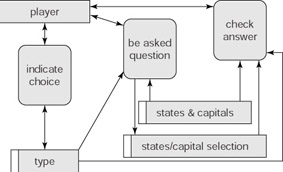
Figure 6.5: Process diagram for state capital quiz.
You might ask, “is it necessary to indicate all variables in data stores to make a proper process diagram?” The answer is “no,” just the ones that are shared between processes. You might now see that at some point, it might be appropriate to move from the planning stage supported by process diagrams to the implementation design stage supported by storyboards.
Before continuing with the state capital example, consider the following general ideas. For implementation, you need to decide on the definition of scripts. The process diagram does not make those decisions for you. It might even be appropriate to combine processes into one script. However, a rule-of-thumb in programming is to “divide and conquer.” Several smaller programs can be easier to develop and debug than one large program. Note that in contrast to the divide and conquer approach, it is a common practice for a single PHP or ASP script to both display a form and handle the form as specified by the action attribute in the form tag. In the implementation of the state capitals, and the other examples in this text, there will be some “self” handling of forms. The benefit of making one file do both tasks is to put everything in one place and to cut down on the number of files. The disadvantage is that these files are more complex. The examples in this text use a mixture of the two techniques.
| Note | Putting everything in one script does not cut down on requests to and responses from the server. The form action specified as the same script still necessitates a call to the server for the PHP or ASP file. The file is interpreted on the server and a new HTML file is sent to the client. |
The mini-quiz storyboard given in the previous section reveals the “self” handling of forms. Moreover, the storyboard indicates the sequence of events. It indicates the link from miniquizcheck back to miniquizask. The diagram did not indicate that both the scripts, for either the PHP or ASP implementation, made use of the facility for including files. The fact that the statements setting up the states and capitals array are in separate files does not change the logic of the programming. Putting the array statements in a separate file would probably be a late decision. To make your documentation complete, you can use Figure 6.6 as a model.
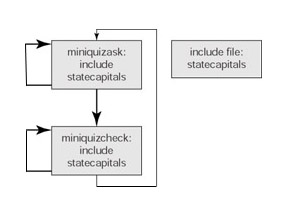
Figure 6.6: Storyboard for state capitals quiz, showing included file.
The reason for putting the words include and included in the diagram is to show how the file is connected to the minequizask and miniquizcheck. When projects contain scripts that have no connection, the storyboard would indicate that by the absence of connecting arrows. If you do build a quiz application with facilities for editing questions, the script or scripts for the editing will not be connected to the scripts for asking and checking questions.
More process diagrams and storyboards will be shown for later examples. Go to the Exercise section for practice.
EAN: 2147483647
Pages: 125