5.3 Building a Performance Model
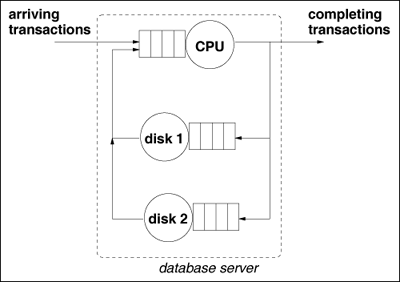
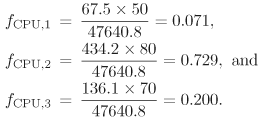
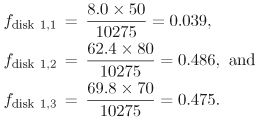
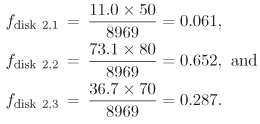
| A performance model for the database server is illustrated in Fig. 5.4. This is a multi-class open queuing network model. Three workload classes are modeled. Each class corresponds to one of the clusters indicated in Table 5.3. In order to obtain quantitative indicators for performance analysis and capacity planning, model parameters are required. As discussed in Chapter 2, these parameters include the workload intensity as well as service demands. Figure 5.4. Queuing network model for the database server. As indicated in Chapter 3, service demands can be obtained from the Service Demand Law as Di,r = Ui,r/X0,r. This equation requires the utilization, Ui,r, of each resource i by each class r. However, the measurements available from the OS Performance Monitor only provide total resource utilization, as indicated in Table 5.2. Therefore, a technique to obtain the per-class utilizations from the total utilization is needed. This is illustrated in the next subsection. 5.3.1 Apportioning Total Utilization to Individual ClassesThe general method of apportioning the total utilization Ui of a resource i to a specific class r is represented by the relationship Equation 5.3.2 where fi,r is a factor (i.e., a fraction) that depends on the type of device being apportioned. Consider the CPU first. The total time required at the CPU by all classes (i.e., 47640.8 msec as indicated in Fig. 5.1) includes user time but does not include kernel time spent by transactions while executing OS code. In fact, if the CPU utilization is computed as the ratio of user mode CPU time to the length of the measurement interval (i.e., 150 sec or 150,000 msec), the CPU utilization would be 0.32. This value is smaller than the 0.45 value for the CPU utilization reported by the OS Performance Monitor (see Table 5.2). However, the percentage of kernel time attributed to each class is assumed to be in the same ratio as the user time attributed to each class. The apportionment factor for the CPU, fCPU,r is derived as follows. Equation 5.3.3 Equation (5.3.3) makes the implicit assumption that a transaction's CPU time in kernel mode is proportional to the CPU time in user mode. The total CPU time for a given class is obtained from Table 5.3 by multiplying the average CPU time for the cluster (i.e., class) by the number of points in the cluster. The total CPU time for all classes comes directly from the statistics gathered from the DBMS Performance Monitor (see Fig. 5.2). Thus, Equation 5.3.4 (Note: These factors represent the percentage of the CPU's load attributed to each workload class. These factors sum to 1.0). The per-class CPU utilizations are computed using the apportionment factors and the total CPU utilization (i.e., 0.45 from Table 5.2) by using Eq. (5.3.2). Thus, Equation 5.3.5 Consider now the disks and the issue of apportioning total disk utilization values to the different classes. The same approach used for the CPU is used in this case. The difference lies in the way the apportionment factor of Eq. (5.3.2) is computed. Instead of using the percentage of time at the device, which is available at the CPU but not at the disks, the percentage of I/O counts is used as follows. Equation 5.3.6 The total number of I/Os on disk 1 is 10,275 as indicated in Fig. 5.1. Using the clustering data in Table 5.3 to determine the number of I/Os per class, the appropriate apportionment factors for disk 1 are: Equation 5.3.7 Similarly for disk 2, the total number of I/Os on disk 2 (from Fig. 5.1) is 8,969. Thus, the apportionment factors for disk 2 are Equation 5.3.8 Using these factors and the disk utilizations found in Table 5.2, Eq. (5.3.2) provides the needed disk utilizations per class. The results are summarized in Table 5.4. This provides a per device, per class utilization breakdown of the OS Performance Monitor data found in Table 5.2.
5.3.2 Computing Service DemandsThe model requires the per device, per class service demands, Di,r. The Service Demand Law (see Chapter 3) states that Di = Ui/X0. Applied to the current multi-class example, Di,r = Ui,r/X0,r. The utilizations, Ui,r, are available from Table 5.4. The throughput for each class, X0,r, is obtained by dividing the number of transactions processed for each class by the duration of the measurement interval. The number of transactions processed per class is given in the last column of Table 5.3. Thus, recalling the measurement interval of 150 seconds, Equation 5.3.9 Using the multi-class device utilizations from Table 5.4 and the multi-class throughputs from Eq. (5.3.9), the multi-class service demands at each device are easily computed from the Service Demand Law, Di,r = Ui,r/X0,r. The results are shown in Table 5.5.
|
EAN: 2147483647
Pages: 166


