12.6 Computer Aided Tracking and Characterization of Homicides and Sexual Assaults (CATCH)
12.6 Computer Aided Tracking and Characterization of Homicides and Sexual Assaults (CATCH)
Lars J. Kangas, [1] Kristine M. Terrones, Robert D. Keppel, and Robert D. La Moria
Battelle Pacific Northwest Division, MS K7-22, Richland, WA 99352
Attorney General of Washington, Criminal Division
12.6.1 Abstract
When a serial offender strikes, it usually means that the investigation is unprecedented for that police agency. The volume of incoming leads and pieces of information in the case(s) can be overwhelming as evidenced by the thousands of leads gathered in the Ted Bundy murders, the Atlanta child murders, and the Green River murders. Serial cases can be long-term investigations in which the suspect remains unknown and continues to perpetrate crimes. With state and local murder investigative systems beginning to crop up, it will become important to manage that information in a timely and efficient way by developing computer programs to assist in that task. One vital function will be to compare violent crime cases from different jurisdictions so investigators can approach the investigation knowing that similar cases exist.
CATCH (Computer Aided Tracking and Characterization of Homicides) is being developed to assist crime investigations by assessing likely characteristics of unknown offenders, by relating a specific crime case to other cases, and by providing a tool for clustering similar cases that may be attributed to the same offenders.
CATCH is a collection of tools that assist the crime analyst in the investigation process by providing advanced data mining and visualization capabilities. These tools include clustering maps, query tools, geographic maps, timelines, etc. Each tool is designed to give the crime analyst a different view of the case data.
The clustering tools in CATCH are based on artificial neural networks (ANNs). The ANNs learn to cluster similar cases from approximately 5,000 murders and 3,000 sexual assaults residing in a database. The clustering algorithm is applied to parameters describing modus operandi (MO), signature characteristics of the offenders, and other parameters describing the victim and offender. The proximity of cases within a two-dimensional representation of the clusters allows the analyst to identify similar or serial murders and sexual assaults.
12.6.2 Introduction
CATCH is being developed to provide crime analysts enhanced means for interpreting large databases of crime data. These databases store a large number of crimes with each case described in a large number of details. Battelle Memorial Institute's Pacific Northwest Division developed CATCH in collaboration with the Attorney General of Washington, Criminal Division. Investigators at the Criminal Division are currently evaluating CATCH.
The development of CATCH was made possible with the HITS (Homicide Investigation Tracking System) database system. Police involved in the infamous Green River and Ted Bundy murder investigations in the State of Washington developed HITS circa 10 years ago to enable the computer-based analysis of murders. The database now contains several thousand violent crimes primarily from the Pacific Northwest, USA.
CATCH provides analysts tools for efficiently viewing crime details and comparing crimes against each other. An initial set of one or more crimes is selected by using point-and-click methods that generate SQL queries to retrieve the set of crimes from the database. This set of crimes is then refined with tools that tell the analyst that specific crimes do not "belong" in the set. The analyst can also add other crimes to the set that should "belong" to the set. The set of crimes may belong together because they appear to be committed by the same offender.
There are two versions of CATCH, one for murders and one for sexual assaults. Although the version of CATCH described here is custom configured specifically for the HITS database of violent crimes, it can be applied against other crime databases through relatively minor changes in the software.
12.6.3 Clustering Algorithm
CATCH uses ANNs for analysis. The benefit of ANNs is often described by means of their information (sensor) fusion capabilities. Information fusion is the process of extracting information from several data sources in parallel. More information can frequently be gained by this approach, compared to processing each data source individually. Another benefit with some ANNs is their ability to extract nonlinear information from data.
The clustering algorithm in CATCH is based on self-organizing maps (SOMs). These networks are also called self-organizing feature maps or Kohonen networks after the inventor, Professor Teuvo Kohonen [11, 6].
The SOMs belong to the unsupervised neural-network class, meaning that the network is not provided any labels that describe the data vectors during a learning phase. Instead, the SOM organizes data vectors into clusters of similar data in regions on a two-dimensional map. Two dimensions provide a convenient visual representation, though it is not a requirement.
The HITS Unit staff at the Attorney General of Washington, Criminal Division use standard forms to record the large number of details describing each crime, which are then entered into the HITS database. CATCH processes these crime details and generates data vectors for numerical analysis. Each data vector includes more than 200 details of each crime.
The SOM in CATCH has 4,096 cells organized as a 64 x 64 grid (see Figure 12.6). The learning phase assigns each crime to exactly one of these cells. The specific cell to which each crime is assigned is based on a clustering algorithm applied during a learning phase. Similar crimes are placed in closer proximity to each other. Identical or nearly identical crimes may be placed in the same cell. Some cells may not be assigned any crimes during the learning phase, but these cells may be assigned new crimes as they are entered into the database between retrainings of the SOM. The SOM should periodically be retrained when a sufficient number of new cases are added to the database to take advantage of all the crime data available.
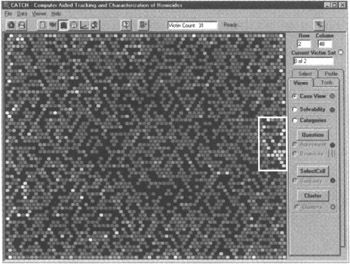
Figure 12.6: The SOM represents about 5,000 murders in the HITS database.
The self-organizing map in Figure 12.6 represents about 5,000 murders in the HITS database. Each of the cells in the 64 x 64 map typically contains eight or fewer crimes. The black cells contain no crimes. The lighter the cell color, the more crimes are in the cell. (The cells are colored in different shades in the application.) The overlaid light rectangle contains light-colored cells that are selected into a current set of crimes being analyzed. (The example set of clustered crimes in the figure is the Green River murders believed to have been commited by one serial offender.)
12.6.4 Database Mining
The tools in CATCH are of two types. First, there are database mining tools to give the crime analyst a better understanding of the content of the database. Second, there are tools that let the analyst retrieve and compare specific crimes.
The self-organizing map is like a window into the database. Each crime in the database has a location on the SOM and the clusters on the SOM link together similar crimes in the database. Thus, the database can be mined for related crimes through the SOM. These mining tools, which use the SOM, include a search tool that lets the analyst select a combination of crime details and see where on the SOM there are crimes for which these details hold true (see Figures 12.7 and 12.8). Another tool allows the analyst to select one crime case and see where in the SOM there are other similar crime cases, based on any combination of the details describing the crimes. CATCH allows the analyst to add to, remove from, or crop the current set of crime cases by selecting areas of cells in the SOM, while mining the database.
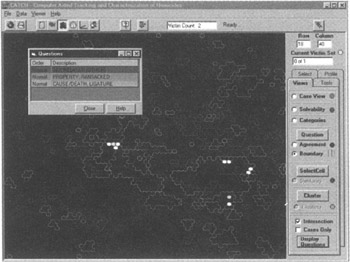
Figure 12.7: Crimes are mapped by modus operandi descriptions.
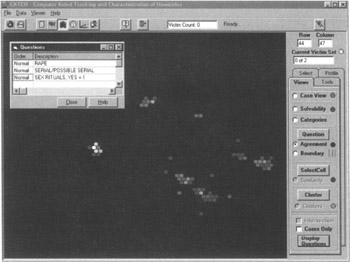
Figure 12.8: Order and description of crimes such as rape, serial and rituals can be queried.
The SOM is overlaid by boundaries around areas of common crime details. The small window shows which details are selected and the color-coding of the boundaries. The user can select crimes that are in the unions of the bounded areas, shown as light-colored cells in the figure.
In Figure 12.8, the depicted tool emphasizes cells containing crimes for which all selected details correctly describe the crimes. The cells in the SOM are colored lighter according to the correlation of the selected crime details (i.e., lighter cells have higher correlation with the selected crime details).
The "starmap" of crimes in CATCH is shown in Figure 12.9. This representation of all crimes in the database is a three-dimensional cube, where the data vectors describing the crimes have been reduced down to three eigenvalues. The cube is viewed by selecting any two of the dimensions. Although a significant amount of information is lost when high-dimensional data is reduced to a few dimensions, the visualization of the data still conveys significant structure of the data in the database. The user can select volumes in the cube to retrieve, remove, and crop crimes from the current set of crimes being analyzed.
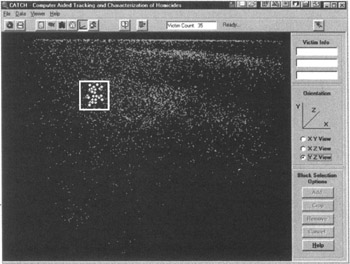
Figure 12.9: The figure shows all the crime data vectors as points in a three-dimensional eigenspace.
Figure 12.9 shows all the crime data vectors as points in a three-dimensional eigenspace. The cube of crimes is viewed in any two of the three dimensions. This cube of crimes gives an alternate view of the clusters and structure of the crimes in the database. Similar crimes form denser areas of "stars" in the cube. The highlighted crimes within the overlaid square are selected into the current working set.
The geographic map in CATCH is shown in Figure 12.10, with crimes placed as pins at the locations where they were committed. This map also allows the user to select an area and retrieve all the crimes in that area, or the user can crop or remove crimes from the current working set of crimes.
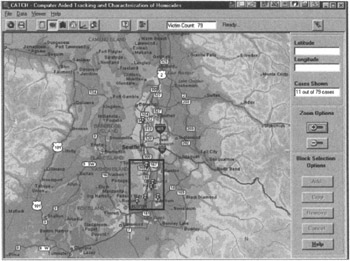
Figure 12.10: Crimes can be mapped along highways.
The geographic map tool in Figure 12.10 places the current set of crimes on the map as pins (see examples in the rectangle). The user can select pins to view additional information about specific crimes.
The tools described above and some additional tools (e.g., a time line tool), allow the crime analyst to retrieve crime data from the database without having to use queries. CATCH automatically generates SQL queries to retrieve requested information from the user's interaction with graphical representations of the data. Thus, although CATCH allows the use of queries in a specific query tool, it has been designed so that a user is removed from having to work with queries when mining the database.
12.6.5 Database Visualization
While the data mining tools are used for rapidly focusing on a set of crimes that may be related, the data visualization tools become the priority for more in-depth analysis of crime data. Some graphical data visualization capabilities of CATCH have been partially described above with the data mining tools. This section describes a few of the tools that allow the users to view, analyze, and compare details describing different crimes. (Because CATCH processes sensitive information, it is necessary to restrict the images of these tools in the figures).
Most of the data visualization tools in CATCH show the crime details in grids that are enhanced by color and order of significance. The color enhancement in the grids is used to give the user improved perception of the data without having to focus on numerical values. Typically, grid values representing crime details are lighter in color if the crime detail has a higher numerical value or if the crime detail holds true for a specific crime. The grids can also be sorted to bring more significant details to the top of the grids. The significance of each detail is dynamically computed in the sorting algorithms.
Figures 12.11 and 12.12 show two tools for comparing crime cases based on labels assigned to sexual offenders. These labels—Power Reassurance, Power Assertive, Anger Retaliatory, and Anger Excitation—were conceived by the FBI to describe the behavior of sexual offenders [1–5]. Dr. Robert Keppel [7–10], chief criminal investigator at the Attorney General of Washington, Criminal Division, developed a weighting scheme applied to these labels. Each specific detail describing crimes has associated weights that are based on how much the detail contributes to the different labels and the rarity of that detail occurring in the HITS database of crimes. The weighting scheme incorporates the expertise of the crime investigators, recognizing that some crime details are more important than others for identifying related crimes by serial offenders.
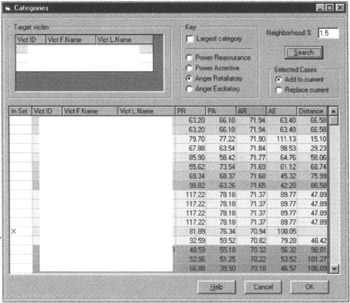
Figure 12.11: Similarity of crimes can be viewed and measured via a grid.
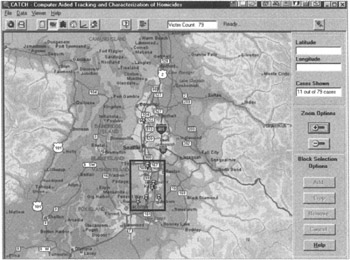
Figure 12.12: Comparison of crime types can be measured.
The grid in the Figure 12.11 shows several crimes, one on each row, which have been determined by CATCH to be similar to a crime being analyzed (marked by an X in the first column). The most similar crimes in the database are retrieved and ordered by the overall weight assigned to one of the four sexual offender labels: Power Reassurance, Power Assertive, Anger Retaliatory, and Anger Excitation. The grid can be used for selecting and removing crimes from the current set of crimes.
The tool shown in the Figure 12.12 allows the crime analyst to compare two crimes side by side according to the sexual offender labels: Power Reassurance, Power Assertive, Anger Retaliatory, and Anger Excitation. The figure shows the individual weights assigned to each of the details and the four labels describing each of the two crimes. The details of the two crimes in the figure are sorted to bring the significant details to the top. The two crimes compared in the figure are both described to have "unusual ritual" and "blindfold" in common. These are two crime details that are relatively rare in the database and may suggest that the same offender committed these two crimes.
12.6.6 Evaluation
CATCH was developed to identify serial offenders by recognizing that serial offenders tend to repeat certain aspects of their crimes. Because the neural-network algorithm clusters similar data vectors, we expect the crimes by the same offenders to be clustered close together. The graphs in Figures 12.13 and 12.14 show the summary of distances found between any pair of crimes committed by the same known offenders for murders and sexual assaults, respectively. Distances are measured as the number of cells between two crimes on the self-organizing map. A distance of zero indicates that both crimes are in the same cell, a distance of one indicates that the two crimes are in adjacent cells, etc.
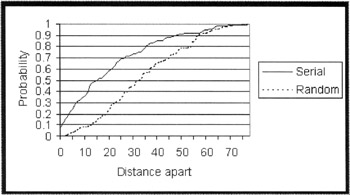
Figure 12.13: Probability and distance of crimes by the same perpetrator can be graphed.
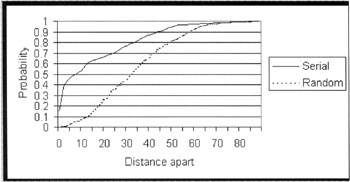
Figure 12.14: The solid line in the graph shows the probability of finding two sexual assaults by one serial rapist n number of cells apart.
The results shown in Figure 12.13 are based on 189 serial murders committed by 81 known offenders. The graph shows that 50% of serial murders by the same offenders are within 15 cells of each other. The results shown in Figure 12.14 are based on 412 serial sexual assaults committed by 154 known offenders. The graph shows that 50% of serial sexual assaults by the same offenders are within eight cells from each other.
The solid line in Figure 12.13 shows the probability of finding two murders by one serial murderer n number of cells apart. Of the related serial murders 50% are found within 15 cells of each other. The dashed line, in comparison, shows the distance between the same murders as they would appear if randomly placed into cells in the self-organizing map. The confidence is greater than 99% against these two probability distributions having the same mean (two-tailed t-test).
The solid line in Figure 12.14 shows the probability of finding two sexual assaults by one serial rapist n number of cells apart. Of the related serial sexual assaults 50% are found within eight cells of each other. The dashed line, in comparison, shows the distance between the same sexual assaults as they would appear if randomly placed into cells in the self-organizing map. The confidence is greater than 99% against these two probability distributions having the same mean (two-tailed t-test).
12.6.7 Conclusion
Crime analysts at the Attorney General of Washington, Criminal Division, are currently evaluating CATCH. Thus, a statement regarding the utility of CATCH must remain pending until the outcome of this evaluation.
Preliminary evaluations suggest that the clustering algorithms and visualization tools in CATCH have the potential to have considerable value to crime analysts. A new version of CATCH is planned to incorporate additional tools that have been identified from the current research and development. The first set of tools in version one of CATCH was concentrated on researching the value of using artificial neural networks to cluster similar cases. The new version will provide crime analysts a more complete suite of tools; for example, a new tool will provide a more complete method for generating SQL statements from graphical representations.
12.6.8 Acknowledgment
This work was supported by the National Institute of Justice.
12.6.9 References
1. Copson, G. (1995) "Coals to Newcastle? Part 1: A Study of Offender Profiling: Police Research Group Special Interest Series," Paper 7, Home Office Police Department, London.
2. Copson, G., R.Badcock, J. Boon, and P. Britton (1997), "Articulating a Systematic Approach to Clinical Crime Profiling," Criminal Behaviour and Mental Health, 1997.
3. Douglas, J.E.,A.W. Burgess,A.C. Burgess, and R.K. Ressler (1992) Crime Classification Manual, New York: Lexington Books.
4. Geberth, V.J. and R.N. Turco (1997) "Antisocial Personality Disorder, Sexual Sadism, Malignant Narcissism, and Serial Murder," Journal of Forensic Sciences 42 (1): pp. 49–60.
5. Geberth, V.J. (1996), Practical Homicide Investigation: Tactics, Procedures, and Forensic Techniques, Third Edition CRC Publishing, Miami, Florida.
6. Kaski, S. Data Exploration Using Self-Organizing Maps, Acta Polytechnica Scandinavica, Mathematics, Computing and Management in Engineering Series No. 82, Espoo.
7. Keppel, R.D. and J.P. Weis (1997), "Time and Distance as Solvability Factors in Murder Cases," Journal of Forensic Sciences, 39 (2), pp. 386–401.
8. Keppel, R.D. (1997), Signature Killers, New York: Pocket Books.
9. Keppel, R.D. (1995), "Signature Murders: A Report of Several Related Cases," Journal of Forensic Sciences, 40 (4), pp. 658–662.
10. Keppel, R.D. (1995), The Riverman: Ted Bundy and I Hunt the Green River Killer, New York: Pocket Books.
11. Kohonen, T. (1997), Self-Organizing Maps, Second Edition, Berlin, Springer-Verlag.
[1]Correspondence: Email: <lars.kangas@pnl.gov>; Telephone: (509) 375-3905
EAN: 2147483647
Pages: 232
- Chapter II Information Search on the Internet: A Causal Model
- Chapter VI Web Site Quality and Usability in E-Commerce
- Chapter IX Extrinsic Plus Intrinsic Human Factors Influencing the Web Usage
- Chapter X Converting Browsers to Buyers: Key Considerations in Designing Business-to-Consumer Web Sites
- Chapter XV Customer Trust in Online Commerce