Chapter 12: Mapping Crime: Clustering Case Work
There are spatial and temporal features to crimes, and today's data analysis tools allow for the display and examination of this digital data. Increasingly, police departments are beginning to use new mapping applications and geographic information systems (GIS) to measure and analyze the spatial relationships of this criminal data. With these new graphical tools, analysts are able to examine place-based crime and develop contiguity matrices to view relationships between criminals and victims. In addition to these analytical advances, computerized police records management systems and computer-aided dispatch (CAD) systems of citizen calls to police make it possible to systematically quantify varying levels of criminal activity and types at different locations within a city.
There are two methods by which crimes can be mapped. One is human-driven, where an analyst interactively explores the features of crimes by different dimensions, such as type of crime by time of day or day of week. This is a top-down approach to mapping criminal activity. The second method of mapping crime, the machine-driven method, where criminal data is autonomously clustered using a data mining tool, such as a SOM neural network. This type of map is driven by the criminal data itself and may lead to the discovery of new, previously unseen patterns and can provide very important insights that a human-driven analysis might miss. This is a bottom-up approach to mapping criminal activity. In the end both the top-down and bottom-up approaches should be considered for they can compliment each other; the bottom-up approach may discover a trend or pattern, which the top-down approach can be used to validate.
12.1 Crime Maps
A crime map may be viewed as the end product of a process that starts with a 911 call and the first-responding officer's report, which is then processed and entered into a database and eventually transformed into a digital report, then into a graphical map. In one interpretation, a crime map is merely a picture of a database of criminal data. However, by inspecting a map, police analysts may notice a relationship or discover a correlation between environmental factors that otherwise might have gone unnoticed. Crimes occur where an opportunity exists, be it due to a lack of night lights, police patrols, or surveillance cameras; a map may bring these facts to light.
Maps are also integral tools for the exploration and testing of hypotheses about crimes and perpetrators. For example, a crime map may confirm an investigator's hunch about the burglary pattern of a repeat offender who is using a specific bus route and its associated stops to enter a neighborhood, commit his crimes, and escape. If so, the map might be used to view the hypothesis and possibly deter the criminal. At the core of this method is an interactive process involving the development and testing of a hypothesis on the basis of the best available information derived from the investigator's experience, the physical evidence, and the distribution of the criminal data. Maps may reveal a pattern not expected, leading to such questions as did the discovered cluster of burglaries pop up by chance? Do officers in the field have a potential suspect? What is this perpetrator's signature MO? Are there other unsolved burglaries that match this pattern?
Maps of crimes are highly persuasive because people tend to instantly grasp graphs, believing what they can see. In 1997 the National Institute of Justice established the Crime Mapping Research Center, whose goal is the promotion, researching, evaluation, development, and dissemination of GIS technology and the spatial analysis of crime. On the CMRC Web site, several links can be found to several police department sites and their GIS maps.
From the CMRC site, shown in Figure 12.1, the user can easily click on any city on the list, such as Beaverton, and view the crimes by each of its 13 neighborhoods (see Figure 12.2).
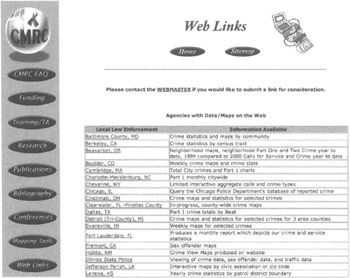
Figure 12.1: MAPS links to crime maps and statistics to various cities.
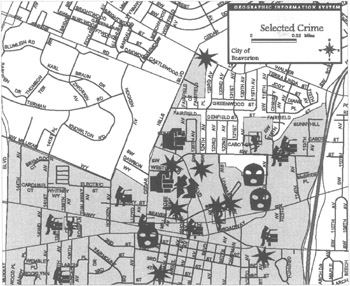
Figure 12.2: A view of crimes by types in the central part of the city.
EAN: 2147483647
Pages: 232