Grouping Project Details
As you develop a project plan, you can use the default views available in Project to view and analyze your data in several ways. One important way to see the data in task and resource views is by grouping. Grouping allows you to organize task or resource information (or, when in a usage view, assignment information) according to criteria you choose. For example, rather than viewing the resource list in the Resource Sheet view sorted by ID, you can view resources sorted by cost. Grouping goes a step beyond just sorting, however. Grouping adds summary values, or “roll- ups,” at intervals that you can customize. For example, you can group resources by their cost with a $1,000 interval between groups.
| Tip | In some respects, grouping in Project is similar to the Subtotals feature in Excel. In fact, grouping allows you to reorganize and analyze your Project data in ways that would otherwise require you to export your Project data to a spreadsheet program. |
Grouping can significantly change the way you view your task or resource data, allowing for a more refined level of data analysis and presentation. Grouping doesn’t change the underlying structure of your project plan; it simply reorganizes and summarizes the data. As with sorting, when you group data in a view, the grouping applies to all tables you can display in the view. You can also group the Network Diagram view, which does not contain a table.
Project includes several predefined task and resource groups, such as grouping tasks by duration or resources by standard pay rate. You can also customize any of the built-in groups or create your own.
| Tip | You can also use the Project Guide to apply a filter or group to a table or to sort information in a table. On the Project Guide toolbar, click Report. In the Reports pane, click the Change the content or order of information in a view link. |
In this exercise, you group resources by their Group name (this is the value in the Group field—Crew, Equipment, and so on). This is similar to the sorting you did in the previous section, but this time you will see summary cost values for each resource group.
-
On the Project menu, point to Group By: No Group, and then click Resource Group.
Project reorganizes the resource data into resource groups, adds summary cost values per group, and presents the data in an expanded outline form. Your screen should look similar to the following illustration:
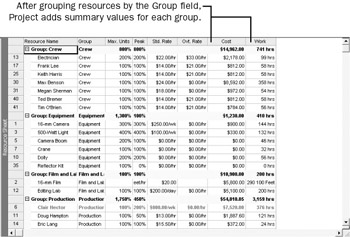
Project applies colored formatting (in this case, a yellow background) to the summary data rows. Because the summary data is derived from subordinate data, you cannot edit it directly. Displaying these summary values has no effect on the cost or schedule calculations of the project plan.
This arrangement of the resource cost information is similar to the sorting you did in the previous section. To give yourself more control over how Project organizes and presents the data, you’ll now create a group.
-
On the Project menu, point to Group By: Resource Group, and then click More Groups.
The More Groups dialog box appears:
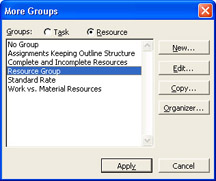
In this dialog box you can see all the available predefined groups for tasks (when in a task view) and resources (when in a resource view). Your new group will be most similar to the Resource Group, so you’ll start by copying it.
-
Make sure that Resource Group is selected, and then click the Copy button.
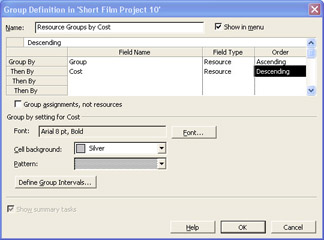
The Group Definition in dialog box appears.
-
In the Name box, type Resource Groups by Cost.
-
In the Field Name column, click the first empty cell below Group.
-
Type or select Cost.
-
In the Order column, select Descending for the Cost field.
The resources will be sorted within their groups by cost from highest to lowest values.
Next you’ll fine-tune the cost intervals at which Project will group the resources.
-
Click the Define Group Intervals button.
The Define Group Interval dialog box appears.
-
In the Group on box, select Interval.
-
In the Group interval box, type 1000.

-
Click the OK button.
-
Click OK again to close the Group Definition in dialog box.
Resource Groups by Cost appears as a new group in the More Groups dialog box.
-
Click the Apply button.
Project applies the new group to the Resource Sheet view. To get a better look at the groupings, you’ll need to widen the Resource Name column.
-
Double-click the Resource Name column heading.
The Column Definition dialog box appears.
-
Click the Best Fit button.
Project widens the Resource Name column. Your screen should look similar to the following illustration:
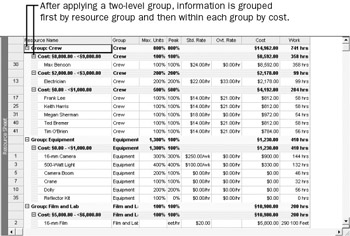
The resources are grouped by their resource group value (the yellow bands that bind together Crew, Equipment, and so on) and within each group by cost values at $1,000 intervals (the gray bands).
To conclude this exercise, you’ll remove the grouping.
-
On the Project menu, point to Group By: Resource Groups By Cost, and click No Group.
Project removes the summary values and outline structure, leaving the original data. Displaying or removing a group has no effect on the data in the project.
| Tip | All predefined groups and any groups you create are available to you through the Group By button on the Standard toolbar. The name of the active group appears on this button, which resembles a box with a drop-down list. Click the arrow in the Group By button to see other group names. If no group is applied to the current table, No Group appears on the button. To learn more about using groups, type Available groups into the Search box in the upper right corner of the Project window. The Search box initially contains the text Type a question for help. |
EAN: 2147483647
Pages: 199