Formatting and Printing Reports
Reports are predefined formats intended for printing Project data. Unlike views, which you can either print or work with on the screen, reports are designed only for printing or for viewing in the Print Preview window. You do not enter data directly into a report. Project includes several predefined task, resource, and assignment reports you can edit to get the information you want.
In this exercise, you view a report in the Print Preview window, and then you edit its format to include additional information.
-
On the View menu, click Reports.
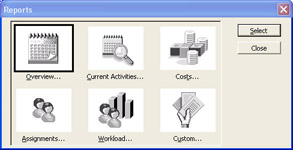
The Reports dialog box appears, showing the six broad categories of reports available in Project. Your screen should look similar to the following illustration:
-
Click Overview, and then click the Select button.
The Overview Reports dialog box appears, listing the five predefined reports in Project that provide project-wide overview information.
-
In the Overview Reports dialog box, click Project Summary, and then click the Select button.
Project displays the Project Summary report in the Print Preview window. This is a handy summary of the project plan’s tasks, resources, costs, and current status. You could use this report, for example, as a recurring status report that you share with the clients or other stakeholders of the project.
Depending on your screen resolution, the text in the report might not be readable when you view a full page.
Tip Here’s a quick way to see vital project statistics on the screen: Click the Project Information command on the Project menu, and then click Statistics.
-
In the Print Preview window, click the upper half of the page with the mouse pointer.
Project zooms in to show the page at a legible resolution. Your screen should look similar to the following illustration:
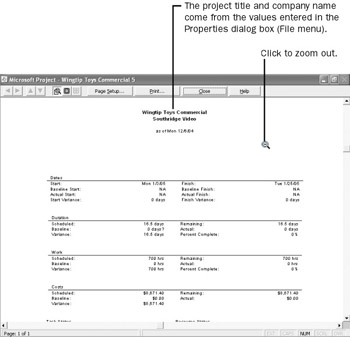
At this point in the project life cycle, the most pertinent pieces of information in the report are the planned start and finish dates and the total cost. If any of these values did not fit within the expectations of the project sponsor or other stakeholders, now would be a good time to find out.
-
On the Print Preview toolbar, click the Close button.
The Print Preview window closes, and the Reports dialog box reappears. Next you will preview and edit a different report.
For a small, simple project such as the TV commercial, a report is a simple way to communicate assignments to the resources involved. To do this, you will work with the Who Does What When report.
Tip This tip describes enterprise project management (EPM) functionality. For more detailed projects, communicating resource assignments (and subsequent changes) and other project details can be a significant responsibility for a project manager. Project Server offers an intranet-based solution for communicating such project details in conjunction with Project Professional. For more information, see Part 4, “Introducing Project Server.”
-
Click Assignments, and then click the Select button.
The Assignment Reports dialog box appears, listing four predefined reports in Project that provide resource assignment information.
-
In the Assignment Reports dialog box, click Who Does What When, and then click the Select button.
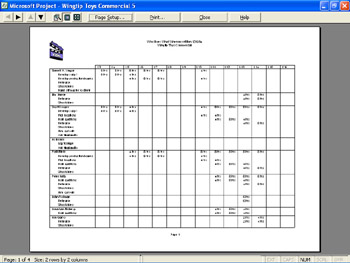
Project displays the first page of the Who Does What When report in the Print Preview window. Your screen should look similar to the following illustration:
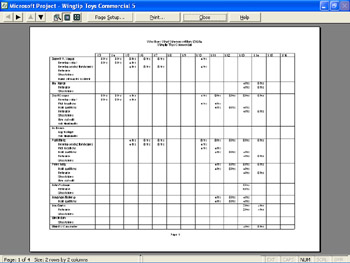
Note that the status bar message tells you this report spans four pages. To get a broader view of the output, you will switch to a multipage view.
-
On the Print Preview toolbar, click the Multiple Pages button.
The entire report appears in the Print Preview window. Your screen should look similar to the following illustration:
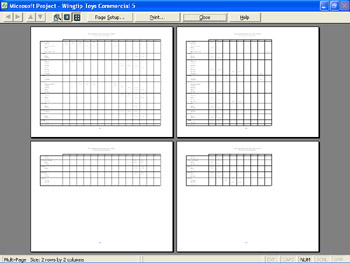
To conclude this exercise, you will customize the header that appears at the top of each printed page so that it includes a logo graphic.
-
On the Print Preview toolbar, click the Page Setup button.
The Page Setup dialog box for the Who Does What When report appears.
-
Click the Header tab.
Your screen should look similar to the following illustration:
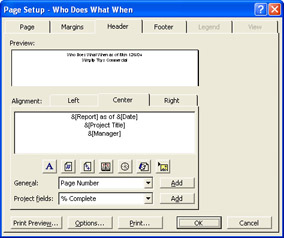
As you can see in the Preview and Alignment boxes, codes such as &[Date] determine the specific text that appears in the header. You will add a logo to the left side of the header.
-
Next to Alignment, click the Left tab.
As with all regions of the header and footer, you can insert standard elements, such as page numbers, as well as any Project field. In this exercise, you’ll insert a logo graphic that’s supplied for you.
-
Click the Insert Picture button.
-
Navigate to the
 Chapter 5 Simple Formatting folder and double-click the Logo file.
The logo image appears on the left side of the header in the Page Setup dialog box.
-
Click OK to close the Page Setup dialog box.
The updated header appears on each page in the Print Preview window.
-
To get a closer look at the updated header, on the Print Preview toolbar, click the One Page button.
Project displays the first page of the report. Your screen should look similar to the following illustration:
-
On the Print Preview toolbar, click the Close button.
-
Click Close again to close the Reports dialog box. The Task Sheet view reappears.
| Tip | You can change the headers and footers of views in the same way you do in reports. Keep in mind that changes you make to the page setup of any view or report apply only to that view or report. However, the general way you customize the page setup is the same for any report or view. |
CLOSE: the Wingtip Toys Commercial 5 file.
EAN: 2147483647
Pages: 199