Chapter 17: Applying Advanced Formatting
![]() Download CD Content
Download CD Content
In this chapter you will learn to:
-
Format the Gantt Chart view.
-
Format the Network Diagram view.
-
Format the Calendar view.
| See Also | Do you need a quick refresher on the topics in this chapter? See the quick reference entries on pages xxxvii–xxxviii. |
This chapter introduces you to some of the more advanced formatting features in Microsoft Office Project 2003. A well-formatted project plan is essential for communicating details to resources, customers, and other stakeholders. Some of the formatting capabilities in Project are similar to those of a style-based word processor such as Word, in which defining a style once affects all content in the document to which that style has been applied. In Project you can use styles to change the appearance of a specific type of Gantt bar, such as a summary bar, throughout a project plan. Other formatting options you’re introduced to in this chapter focus on the different ways of identifying tasks and formatting some of the more commonly used views.
| Important | On the CD Before you can use the practice files in this chapter, be sure you install them from the book’s companion CD to their default location. See “Using the Book’s CD-ROM,” on page xiii, for more information. |
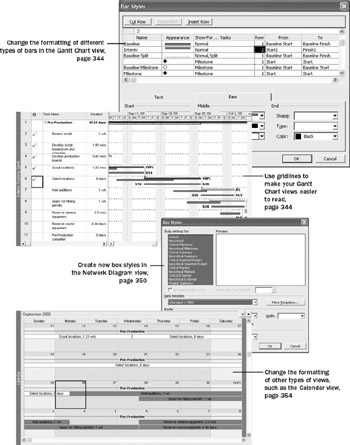
Formatting Bar Styles in a Gantt Chart View
You can directly format specific items (a milestone, for example) in a Gantt chart view or use the Gantt Chart Wizard (on the Format menu) to change the look of a Gantt chart view in limited ways. To change the overall appearance of a Gantt chart view, however, you use the Bar Styles command on the Format menu.
| Note | Remember that several views are Gantt chart views, even though only one view is specifically called the Gantt Chart view. Other Gantt chart views include the Detail Gantt, Leveling Gantt, Multiple Baselines Gantt, and Tracking Gantt. Gantt chart view generally refers to a type of presentation that shows Gantt bars organized along a timescale. |
In addition to changing the formatting of objects that appear by default in a Gantt chart view (such as a task’s Gantt bar), you can add or remove objects. For example, it may be useful to compare baseline, interim, and actual plans in a single view. Doing so helps you evaluate the schedule adjustments you have made.
In this exercise, you display the current schedule along with the baseline and the interim plan. (The baseline and the interim plan were previously saved in the project plan.) You begin by customizing a copy of the Tracking Gantt chart view.
OPEN: Parnell Film 17a from the \My Documents\Microsoft Press\Project 2003 Step by Step\Chapter 17 Advanced Formatting folder. You can also access the practice files for this book by clicking Start, All Programs, Microsoft Press, Project 2003 Step by Step, and then selecting the chapter folder of the file you want to open.
-
On the File menu, click Save As.
The Save As dialog box appears.
-
In the File name box, type Parnell Film 17, and then click the Save button.
-
On the View menu, click More Views.
The More Views dialog box appears.
-
In the Views list, click Tracking Gantt, and click the Copy button.
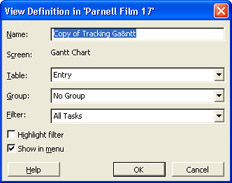
The View Definition dialog box appears:
-
In the Name box, type Interim Tracking Gantt, and click OK.
The new view is listed in the More Views dialog box.
-
Click the Apply button.
Project displays the new view, which at this point is identical to the Tracking Gantt view.
Next you will add the interim plan bars to the view.
-
On the Format menu, click Bar Styles.
The Bar Styles dialog box appears.
You can also display this dialog box by double-clicking the background of the chart portion of a Gantt chart view.
-
Scroll down the list of the bar styles, and in the Name column, click Baseline Split.
-
Click the Insert Row button.
Project inserts a row for a new bar style in the table.
-
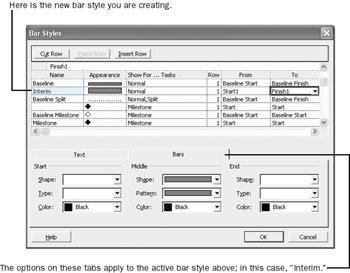
In the new cell, type Interim.
Interim is the name you’ll give to the new task bar that will appear on the chart portion of the view.
Tip The names of most task bars will appear in the legend of printed Gantt chart views. If you do not want your custom task bar name to appear in the legend, type an asterisk (*) at the beginning of the task bar name. For example, if you wanted to prevent Interim from appearing in the legend, you would enter it’s name here as *Interim. For example, in the Bar Styles dialog box you can see that the Rolled Up Task bar name (among others) is prefaced with an asterisk, so it does not appear in the legend of a printed Gantt chart view.
-
In the same row, click the cell under the Show For…Tasks column heading, and then click Normal in the drop-down list.
The Show For … Tasks value indicates the type of task the bar will represent, (such as a normal task, a summary task, or a milestone) or the status of the task (such as critical or in progress).
This is a fairly complex dialog box in Project, but it is extensively documented in online Help. To see Help for this dialog box, click the Help button.
-
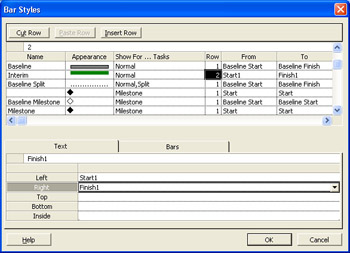
Click the cell under the From column heading, and click Start1 in the drop-down list.
-
Click the cell under the To column heading, and then click Finish1 in the drop-down list.
The From and To values represent the start and end points for the bar. Your screen should look similar to the following illustration:
The Start1 and Finish1 items are the fields in which the first interim plan values were previously saved for you in the project plan. The current start date and finish date of each task in the project were saved to these fields when the interim plan was saved.
You have now instructed Project to display the first interim plan start and finish dates as bars; next you will specify what these bars should look like.
-
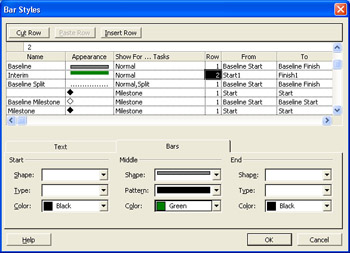
Click the cell under the Row column heading, and click 2 in the drop-down list.
This causes Project to display multiple rows of Gantt bars for each task in the view. Next focus your attention on the lower half of the Bar Styles dialog box.
-
In the Shape box under the Middle label, click the half-height bar, the third option from the top of the list.
Troubleshooting The Bar Styles dialog box is one of several dialog boxes in Project that contains tabs (and is referred to as a tabbed dialog box). If you don’t see the Shape box mentioned in the previous step, verify that the Bars tab is active and not the Text tab.
-
In the Pattern box under the Middle label, click the solid bar, the second option from the top of the list.
-
In the Color box, click Green.
Your screen should look similar to the following illustration:
Because this custom view focuses on the interim plan, next you’ll format the interim bars to include their start and finish dates.
-
In the Bar Styles dialog box, click the Text tab.
-
In the Left box, click Start1 in the drop-down list.
Tip You can type a letter in a field name list to go directly to fields that begin with that letter. For example, you can type S to go to the items that begin with S.
-
In the Right box, click Finish1 in the drop-down list.
Selecting these values will cause the Start1 and Finish1 dates to appear on either side of the bar. Your screen should look similar to the following illustration:
-
Click OK to close the Bar Styles dialog box.
Project displays the interim bars on the Interim Tracking Gantt view, although it’s possible that no Gantt bars will be visible on your screen yet. Next you will get a better look at the Gantt bars.
-
On the Edit menu, click Go To.
The Go To dialog box appears.
-
In the ID box, type 6, and click OK.
Project scrolls the view to display the Gantt bars for task 6 and its adjacent tasks. Your screen should look similar to the following illustration.
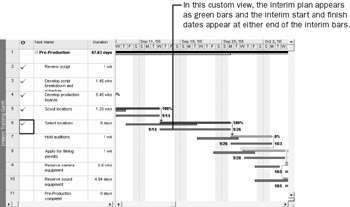
Here you can see that the completed task 6 (shown as a solid blue bar at the top of the task row) corresponds exactly to its interim plan bar (the green bar at the bottom of the task row) and that both were scheduled later than the baseline (the patterned gray bar in the middle of the task row). That is because after the baseline was saved, changes to the schedule were made that pushed out the scheduled start date of the task.
To conclude this exercise, you’ll display horizontal gridlines on the chart portion of the Interim Tracking Gantt view to better distinguish the rows of Gantt bars per task.
-
On the Format menu, click Gridlines.
The Gridlines dialog box appears.
-
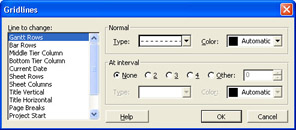
In the Line to change box, make sure that Gantt Rows is selected, and then in the Type box, click the long dashed line, the last option in the list.
Your screen should look similar to the following illustration:
-
Click OK to close the Gridlines dialog box.
Project draws gridlines between task rows in the chart. Your screen should look similar to the following illustration:
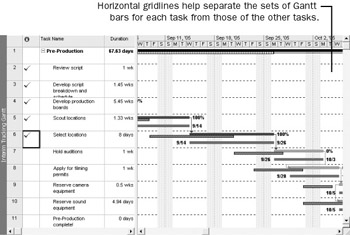
Displaying gridlines like this is a great idea when you print multiple Gantt bars for each task.
EAN: 2147483647
Pages: 199