Schedule Development
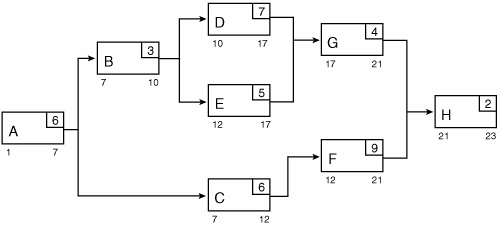
| Schedule development is the process of determining a project's realistic start and finish dates. This does not mean that the resulting schedule will please the project sponsor, but at least this is the starting point. The schedule development is an iterative process that brings together all the previous steps plus some additional input integrated from the other areas such as cost estimating. Most project managers do the previous steps in time management at the same time as schedule development. The use of project management software, such as Microsoft Project, makes combining steps much easier. Understanding Lag and Lead is important to schedule development and thus is important for the PMP exam. Lag and Lead fine-tune task dependencies by offsetting or overlapping tasks. Lag is a delay in the schedule that is out of your control or that may simply be part of the nature of the activities. For example, you may have a two-week delay between ordering application servers and installing them because of shipping. Other important factors are resource pools within the organization, personal calendars, and constraints that are already listed as organizational process assets or in the project Scope Statement. Understanding your available resource capabilities and experience will affect the schedule, as will holidays and resource vacation. Imposed dates and key events can limit scheduling flexibility. The tools and techniques in PMBOK for putting these inputs together to develop the schedule include the Critical Path Method (CPM), schedule compression, what-if scenario analysis, and resource leveling. These tools will be covered on the exam. Let's look at them in detail. The PMBOK describes CPM as "a method that calculates the theoretical early start and finish dates, and the late start and finish dates, for all schedule activities without regard for any resource limitations" (PMBOK, p. 145). CPM examines start and finish dates to calculate the activity and dependencies path with the least scheduling flexibility. The Forward Pass Through Network determines Early Start for each activity. Early Start defines the earliest an activity can start based on the defined schedule logic. Backward Pass Through Network determines Late Start for each activity. Late Start defines the latest an activity can start without delaying the project completion date, based on the defined schedule logic. Forward Pass Through Network Logic: starting with the project start date, this is defined as the Early Start (ES) date for the first network activity.
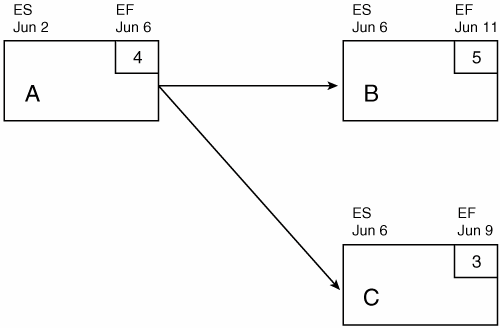
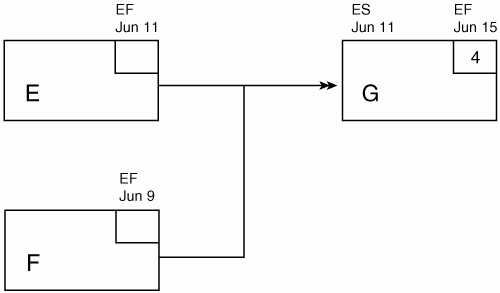
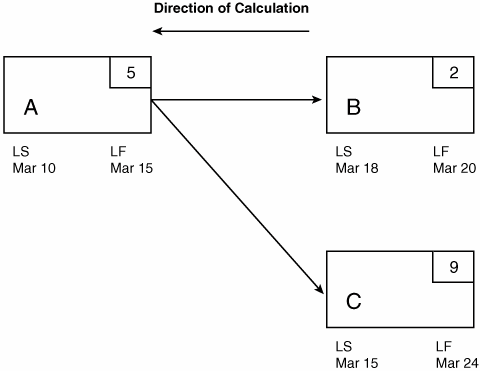
Figure 10-3. Forward pass example 1. When activity has multiple predecessors, the Early Start (ES) of the successor activity is the latest of the Early Finish (EF) dates of the predecessor activities. Figure 10-4. Forward pass example 2. Figure 10-5. Forward pass example 3. Backward Pass Through Network is similar to a Forward Pass. Backward Pass Through Network Logic: starting with the project Late Finish (LF) date from the Forward Pass through Network.
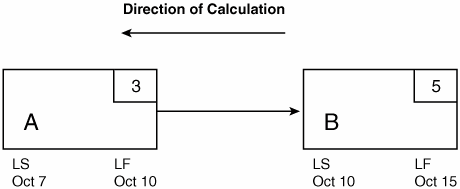
Figure 10-6. Backward pass example 1. When activity has multiple successors, use the earliest Late Start (LS) of the successor activities. Figure 10-7. Backward pass example 2. Figure 10-8. Backward pass example 3. For CPM, these passes through the network are used to calculate Float or Slack. Float is defined as:
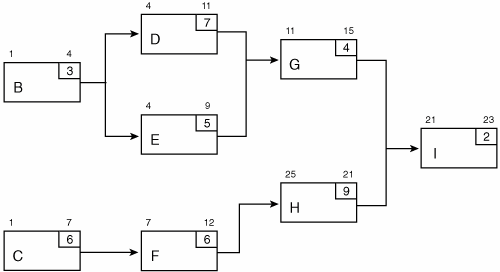
From this calculation, you can see that you have scheduling flexibility if Float is greater than zero (0). If Float is less than zero (0), then the schedule cannot be met without re-planning. Finally, the Critical Path is defined as the total Float of the activities on the Critical Path equaling zero. Figure 10-9. Critical Path example.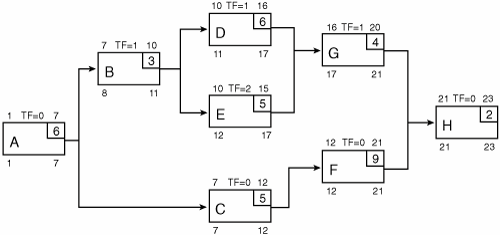 Below is a second Critical Path example, which is slightly more complex. However, the PMP exam has simple, straightforward Critical Path calculations. By recalculating the early and late start/finish dates in the two examples, you can prepare yourself for the PMP exam questions. Figure 10-10. Second Critical Path example.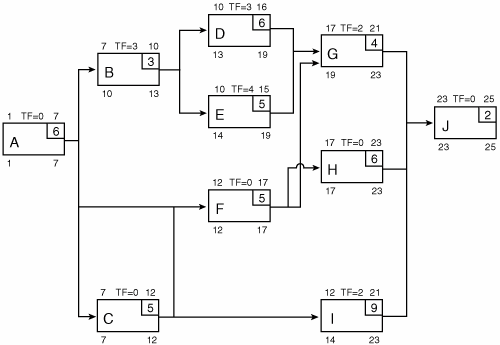 What-If Scenario Analysis "is an analysis for the question 'What if the situation represented by scenario 'X' happens?'" (PMBOK, p. 146). This will test the project schedule under different conditions and help assess the impact. Simulation involves "calculating multiple project durations with different sets of activity assumptions" (PMBOK, p. 146). Monte Carlo Analysis is the most common technique. Monte Carlo uses probable durations for activities to calculate total project duration. Monte Carlo involves doing multiple iterations of possible scenarios so that the final output of a Monte Carlo simulation is a distribution curve that shows the range of possible activity durations.
The answer is B. Resource Leveling is another tool in schedule development. Resource Leveling removes the peaks and valleys of resource allocation. This technique also examines resource over-allocation and critical resource allocation. This technique lets the schedule and cost slip. Leveling Heuristics are rules of thumb and are often used to level or allocate resources. Some examples of Leveling Heuristics are the 80/20 rule and the assigning of critical resources first to Critical Path activities. It is possible to extend working hours and work on weekends to reduce critical duration. However, planning overtime before the start of the project removes the most effective project management tool available to pull the schedule back when those unknowns surface. You should also be careful to consider tiring the project team. It is possible to do extra work for a short period of time, but after that, the work quality level will go down, and the team will be put under great stress. Long durations of stress are certain to cause problems on the project.
The answer is A. These are rules that occur naturally and can sometimes be used to level resources on a project schedule.
The answer is D. By using multiple scenarios, the Monte Carlo simulation technique shows a range of possible events. Productivity measures, such as using different technologies and machinery, can also shorten duration with increases in resource's productivity. Project Management Software can produce an optimal project schedule by addressing Critical Path activities with resource allocation. "This technique is sometimes called the resource-based method" (PMBOK, p. 147). A relatively new technique is the Critical Chain Method. Critical Chain combines calculating Critical Path and applying resource availability. The Critical Chain Method adds duration buffers throughout the schedule instead of at one point in the schedule. Schedule Compression is used to shorten the schedule. The two main techniques are Crashing and Fast Tracking. Crashing involves adding more resources to the Critical Path activities to shorten these activities' durations. Although Crashing may save time, it almost always results in increased costs. Doing more activities in parallel is Fast Tracking. This often results in rework and usually increases risk. Many project managers will shorten the schedule by arbitrarily reducing every task by 20%. This is not an appropriate project management technique, so expect it as an answer on the exam. Why, you ask? It is more effective to shorten tasks on the Critical Path. It is best to see all the alternatives before selecting the one with the least impact.
The answer is C. By Fast Tracking on the Critical Path, you compress the longest path and gain duration.
The answer is A. Be aware that doing Fast Tracking may save some time but almost always results in rework, which may negate the time savings. The output of schedule development is the project schedule. The project schedule can be displayed in different ways, such as Bar (Gantt) Charts, Network Diagrams (CPM & PDM), and Milestone Charts. Let's look at the differences and when to use each: Bar Charts
Network Diagram
Milestone Charts
Schedule supporting data is developed and updated. This documentation includes but is not limited to activity attributes, assumptions and constraints, and resource requirements. The approved project schedule from the alternatives available is called the schedule baseline.
The answer is D. Bar charts show progress and are useful tools, but they do not show any of the answers listed above. | ||||||||||||||||||||||||||||||||||||||||||||||||||||||||||||||||||||||||||||||||||||||||||||||||||||||||||||||||||||||||
EAN: 2147483647
Pages: 167
