OLAP
 |
| |||||||||
Online Analytical Processing (OLAP) is an approach to processing information that helps an organization look at its stored data from a wide variety of possible information perspectives or views. Its goal is to put data for multiple variables of a problem at a user’s fingertips so that they can perform what-if analysis and variable combinations without programmer intervention or the resources of the Information Technology (IT) department. OLAP is both a data storage technique and a data analysis methodology.
| Note | To use Crystal’s OLAP features, you must have the Professional, Developer, or Advanced version of Crystal Reports 9. |
Understanding OLAP
OLAP combines multidimensional analysis of data with the ability for users to navigate through the data and make parameter changes during the analysis for maximum flexibility. This specialized type of data analysis can be used in the following ways:
-
Compare analyses of historical and projected data
-
Model “what-if” data scenarios
-
Analyze trends over a time period
-
Summarize data while allowing drill-down for further analysis
-
Interact with data to change comparisons while viewing the data
Figure 12.36 displays an OLAP grid that compares the sales of products in a company over the course of two years, showing store cost, store sales, unit sales, and profit numbers.

Figure 12.36. An example of an OLAP grid
Business Uses for OLAP
The business question asked for an OLAP approach is typically more complex than for the basic summarization methods used on numerical data. For example, you might want to know the effect on resort prices if the cost of liability insurance went up by 10 percent and labor costs went down by 2 percent. For OLAP support and answering this type of question, Crystal provides basic navigation and browsing of data (fondly known as “slice and dice”) and interactive analysis capability. The business uses of OLAP include the following:
-
Budgeting
-
Cost allocations
-
Customer analysis
-
Financial analysis
-
Financial modeling
-
Market research analysis
-
Sales analysis
-
Sales forecasting
| Analysis Type | Sample Scenarios | Tool |
|---|---|---|
| One-Dimensional | Total sales | Simple data rollups in a report |
| Two-Dimensional | Profit = sales – expense | Cross-tab or spreadsheet |
| Multidimensional | Profit for all products, for all regions, for all time periods, etc. | OLAP grid |
| Cross-Dimensional | Advertising expense attributed to one business unit for a particular product based on the product’s projected sales as compared to the company’s total sales and advertising expense |
OLAP Client-Server Technology
Like sophisticated relational database management systems, high-end OLAP involves sophisticated data storage techniques, including an OLAP server and an OLAP client.
OLAP Server An OLAP server is a specialized database that stores and serves multidimensional data. The storage structure stores a data item using a reference to the dimensions (parameters) that define the item; in essence, the intersection is stored by virtue of the existing row and column.
OLAP Client The concept of an OLAP client is a software product or application that requests data from an OLAP server. The client provides the ability to analyze the multidimensional data. Crystal Reports is an OLAP client; it can retrieve data from OLAP servers, process it, and present it in a report for real-time manipulation.
Creating an OLAP Grid
Crystal Reports 9 works with OLAP data cubes. OLAP cubes are not created in Crystal Reports, but Crystal Reports can access data stored in a
cube in the same conceptual way that it accesses data stored in a relational table. There are two ways to bring cube data into Crystal:
-
Using the OLAP Report Creation Wizard
-
Using the OLAP Expert
When you’re building a new report and select the option to use the Report Wizard, OLAP is a wizard choice. Using the wizard presents the same screens as using the OLAP Expert, except that the OLAP Expert displays the screens in a single tabbed dialog while the OLAP wizard walks you through one screen at a time.
To use the OLAP Expert to create an OLAP grid in an existing report, select Insert > OLAP Grid from the main menu in Crystal Reports; this displays the OLAP Expert shown in Figure 12.37. Using one tab a time, this expert walks you through the process of selecting data, arranging it in the grid, and styling it. We’ll use the OLAP Expert dialog in this chapter.
Configuring Data Options
Selecting the data source is the first step. Click the Select Cube button to bring the OLAP data into Crystal Reports for processing. You can use an existing cube or a CAR file. CAR files are OLAP analysis files created by Crystal Analysis Professional. Connections to OLAP data through Crystal are done with either a direct connection to an OLAP server or through an OLAP gateway accessible through the Internet. Crystal Reports supports a wide spectrum of OLAP data sources, including:
-
Microsoft’s OLE DB Provider for OLAP Services
-
IBM DB2 OLAP Server
-
Holos Live Server
-
IBM Informix MetaCube
-
Hyperion Essbase
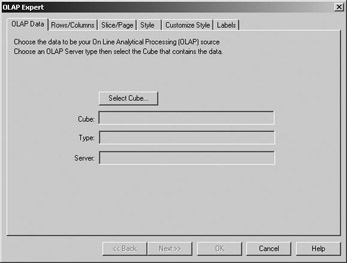
Figure 12.37. Starting the OLAP process
When you click the Select Cube button, the Crystal OLAP Connection Browser shown in Figure 12.38 appears. Here you can open the type of OLAP data source for the report from the list of those already known to Crystal.
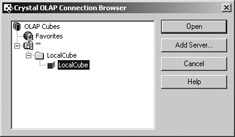
Figure 12.38. Choosing an OLAP data source
If the data source you want to use is not listed, click the Add Server button to open the New Server dialog shown in Figure 12.39. From here, you can choose an OLAP server, a local cube file (.CUB), or an HTTP cube accessed with a URL, username, and password.
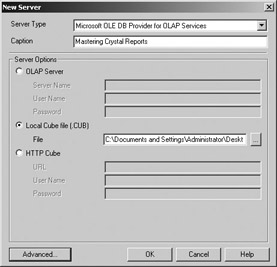
Figure 12.39. Adding an OLAP server
The Advanced Settings button lets you specify how to make the connection to the data. Connecting directly to an OLAP server (or bypassing it for local cube files) is the default option; there are three options in total:
-
Direct to OLAP server (the preselected default)
-
Using Crystal Enterprise Automated Process Scheduler (APS)
-
Choosing Open OLAP with a named service host and service port
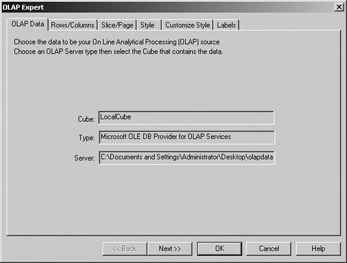
Figure 12.40. The OLAP Expert
Rows/Columns
On the Rows/Columns tab, Crystal creates the initial list of dimensions on examination of the underlying data source. The data for the example in Figure 12.41 has four dimensions: Time, Measures, Product, and Yearly Income. We added Time to the Rows area by selecting it in the list of Dimensions and using the arrow key to move it to the row. Likewise, we’ve already moved Measures to the Column area.
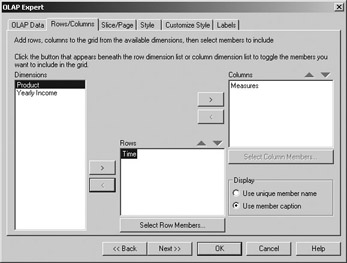
Figure 12.41. Adding rows and columns
Moving Product to the Rows area and Yearly Income to the Columns area will configure the grid as it appears in Figure 12.36, shown previously.
When choosing values to add to the Columns area, keep in mind that Crystal processes information one page at a time. Using a large number of columns may force the grid to be wider than 8.5 inches (for an 8 1⁄2 x 11 " piece of paper), which means that Crystal has to evaluate all the data in the cross-tab before it can display the columns of data. For better performance, try using rows as the dimension that takes up the most space, since this will benefit from the page-at-a-time evaluation. For more information on Crystal’s evaluation process, see Chapter 14, “The Report Engine Processing Model.”
Slice/Page
The Slices area is for dimensions that will not initially be shown in the grid as rows and columns. If the Dimensions list has any items remaining, they are carried over onto the Slice/Page tab, as shown in Figure 12.42. The slices can later be interactively added to the grid using a drag-and-drop technique.
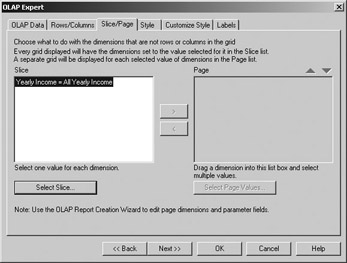
Figure 12.42. Adding slices
Styling an OLAP Grid
The Style, Customize Style, and Labels tabs in the OLAP Expert add formatting controls to the grid. In the same way that you can apply built-in styles or customized styles to cross-tabs, you can add the same styling capabilities to OLAP grids.
Built-In Styles
The Styles tab contains a list of built-in styles that you can use to spruce up your cross-tabs with color schemes, font combinations, and cell border variations. Styles range from the Original style, a simple grid with a white background and black text, to the Custom style, which can be any combination of formatting features. Figure 12.43 shows the Old Photograph style.
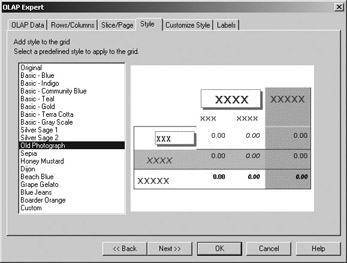
Figure 12.43. OLAP grid styles
You can use the Custom style at the bottom of this list to completely define an OLAP style. To use it, select the Custom option and then switch to the Customize Style tab.
Customizing a Style
The Customize Style tab, shown in Figure 12.44, uses the style specified on the Style tab as a starting point and then allows individual changes to rows and columns.
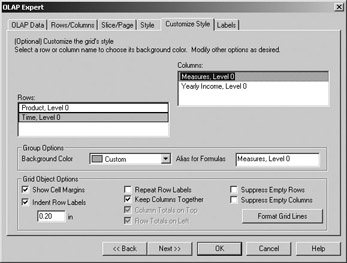
Figure 12.44. Customized OLAP styles
To customize options for a row or column, first select it in the appropriate area on the top half of the screen. Then use the options in the Group Options area to assign an alias to a row or column that can be used in a formula and to change the background color of each row independently of the other rows and columns.
The Grid Options area contains settings that affect the OLAP grid as a whole. The following types of options can be enabled or disabled using the associated check box, and any combination of these options is allowed:
-
Show Cell Margins
-
Indent Row Labels (and set the indent size in inches)
-
Repeat Row Labels
-
Keep Columns Together
-
Column Totals On Top
-
Row Totals On Left
-
Suppress Empty Rows
-
Suppress Empty Columns
The Format Grid Lines button controls the visibility, color, style, and width of each of the grid lines in the OLAP grid in the same manner as was done for cross-tabs (see Figure 12.33).
Customizing an OLAP Grid
After creating an OLAP grid and placing it in the report, you can continue to customize all aspects of the grid as well as perform additional tasks on it. The cells of the grid can be resized by selecting the field in the cell and resizing just as you would any other field in a Crystal report.
When the OLAP grid is selected, the Format menu provides access to the Format OLAP Grid option, the OLAP Grid Expert, and the Pivot OLAP Grid option. Right-clicking a selected OLAP grid provides access to a slightly different set of choices, as shown in Figure 12.45. The difference between this submenu and the Format menu on the main screen is that from here you can select Insert Chart or Insert Map to directly add a chart or map to the report based on the summarized data in the OLAP grid.
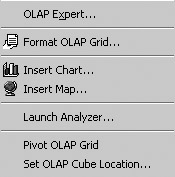
Figure 12.45. OLAP menu options
You can reopen the OLAP Expert at any time to customize the options selected while the grid was being built. You can change all or any of the original settings.
| Tip | When you right-click an OLAP grid to display its submenu of options, be sure to right-click the upper-left corner of the OLAP grid and not any of the individual cells. Clicking an individual cell will display a formatting menu specific to the field in the cell. |
Pivoting an OLAP Grid
Like a cross-tab, an OLAP grid can be pivoted to swap the row and column axes. Switching rows to columns and vice versa can help size the grid more appropriately on a page based on its content. To pivot an OLAP grid, select it, right-click to open its menu, and select Pivot OLAP Grid. Alternatively, with the grid selected, choose Format > Pivot OLAP Grid.
Interactive Analysis with OLAP Grids
OLAP data lends itself to interactive processing that gets the user involved in analysis while looking at the grid. Crystal provides two mechanisms for this interactive analysis:
-
In-place editing
-
Analzyer utility
In-Place Editing
When viewed in Preview mode in Crystal Reports, the OLAP grid is an active in-place editing object. You can select any of the column headings and drag and drop them to a different column heading location to analyze the data in different ways. This lets the user think through a problem interactively by comparing one value against another in real time. When a column title is selected, dragging it to a new location converts the mouse pointer to an icon that resembles a piece of paper. Figure 12.46 shows a single OLAP grid whose columns were repositioned in Preview mode by dragging and dropping column headings; the original grid appears in Figure 12.36.
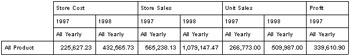
Figure 12.46. OLAP grid after interaction
| Note | Data cells cannot be repositioned to column locations; selecting a data cell and attempting a move operation will result in the table repositioning as a unit. |
Analyzer
Crystal includes a built-in analysis tool specifically for OLAP grids. With a grid built and selected, choose the Launch Analyzer option from the OLAP menu visible in Figure 12.45. This opens the Cube View of the Analyzer, as shown in Figure 12.47. This is the same data that was seen earlier in non-interactive mode in Figure 12.36.
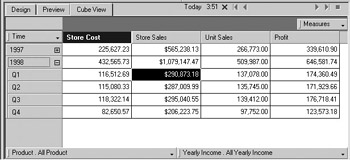
Figure 12.47. Analyzer’s Cube View
OLAP data is three-dimensional:
-
Row
-
Column
-
Slice
The row dimension in Figure 12.47 is Time. The column dimension is Measures. The slice dimension contains both Product and Yearly Income. To interact with the cube data, drag and drop columns, rows, and slices to different positions to show different views of the data. Alternatively, you can right-click an area to display a submenu specific to that area. The main Crystal Reports menu is not used to interact with cube data.
While data on the Cube View cannot be changed, it can be selected to show additional information as well as perform operations on the data. Right-clicking a piece of data in an intersection cell (such as $290,873.18, the intersection of Store Sales and the Q1 in 1998) brings up a submenu containing the Show Cell Properties option, which can give you information on the formatted value of the field and the field’s actual value. This is handy when cells have been formatted to round or truncate values. Right-clicking a dimension displays a submenu with options to swap the position of the dimension with another dimension or to swap rows with columns. The bulk of the menu interactions for a cube, however, are done on the category and subcategory titles displayed in the row dimension. In Figure 12.47, right-clicking the title 1997 in the row displays the menus shown in Figure 12.48.
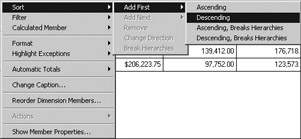
Figure 12.48. Row menus
Each of the menu items allows you to perform an analysis action on the data. For instance, choosing the Highlight Exceptions option opens the dialog shown in Figure 12.49, which is used to add colors to the grid based on threshold values in the data. Each cell can be turned a series of colors (green, then yellow, then red, for example) depending on which threshold range the data value falls into.
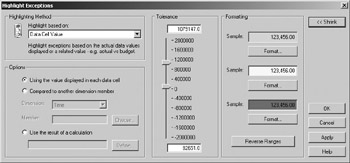
Figure 12.49. Highlighting threshold values
The rows in Figure 12.47 present the Time dimension, which consists of the years 1997 and 1998, with each year having four subcategories for the quarters. The drop-down arrow and plus signs indicate that a category is expandable. When you click the drop-down arrow for a dimension, its Member Selector window opens. This window lets you select any or all of the subcategories for display in the OLAP grid. For this example, there are four dimensions: Time, Measures, Product, and Yearly Income. Time and Measures are currently open in the grid; Time is on the row axis and Measures is on the column axis. Product and Yearly Income are sitting on the bottom of the cube, an area called the slice area. Figures 12.50, 12.51, 12.52, and 12.53 show the Member Selector windows for the Time, Measures, Product, and Yearly Income dimensions.
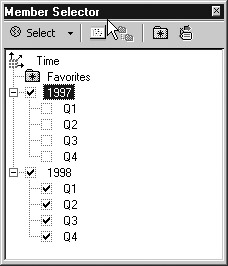
Figure 12.50. Time - first dimension
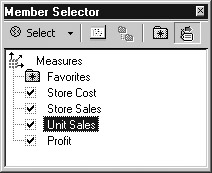
Figure 12.51. Measures - second dimension
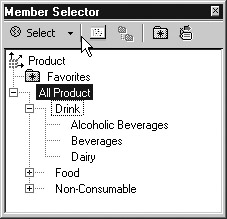
Figure 12.52. Product - third dimension
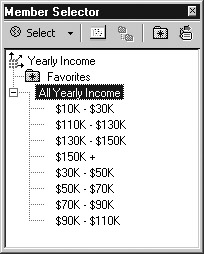
Figure 12.53. Yearly Income - fourth dimension
| Tip | To open a Member Selector as a free-floating window, click the down arrow on the right edge of the dimension identifier, use the mouse to highlight the gray line in the window’s title bar, and when it changes to a blue line, select it and drag it to the middle of the screen. |
To interact with the data and compare variables against one another for different views (or slices) of the data, drag and drop the dimensions from the bottom of the cube up to the row or column heading area. In Figure 12.54, the Measures dimension has been dragged to the row position and both Yearly Income and Product have been dragged to the column position to show the sales for the different years by product and income generated. The bottom of the cube no longer contains any dimensions, and the message “Drop dimensions here to display as slices” is shown.
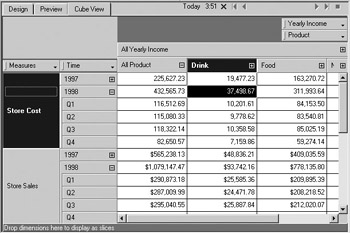
Figure 12.54. Dimensions rearranged
| Warning | The Edit Undo option and Undo icon are disabled in Cube View mode. You cannot undo a dimension rearrangement in this way. Instead, you must reposition the dimensions by dragging and dropping them on their original positions. |
The Analyzer is a powerful interactive OLAP client, and the features in this section have introduced you to its use. The best way to learn to use this tool, though, is to grab some cube data from your own company and start playing with it. Enjoy!
| Note | The Analyzer tool included in Crystal Reports is a subset of the Crystal Decisions’ Crystal Analysis Professional (CA Pro) software. CA Pro is a separate product in the Crystal Decisions line of business intelligence tools and is specifically designed to work with OLAP data in a desktop, network, or Web environment. |
Formatting an OLAP Grid
In Design and Preview modes, you can use the Format Editor to set basic options for how the grid looks in these modes. To open the Format Editor for an OLAP grid, select the OLAP grid on the page and then choose Format > Format OLAP Grid, or right-click the selected OLAP grid to directly choose Format OLAP Grid from the submenu. The Format Editor contains tabs that allow you to format the current object of focus (the OLAP grid) for page and layout issues. As with other objects in Crystal, the universal Format Editor can be used to format the OLAP grid with such options as conditionally suppressing based on a formula, drawing a border around the cross-tab, and adding a hyperlink to another destination. Every object in Crystal is also given a unique object name, like OLAPGrid1, so that it can be manipulated behind the scenes using programming languages. The object name is preset in the Format Editor, or can be changed to reflect something more meaningful to the application.
| Use of content on this site is expressly subject to the restrictions set forth in the Membership Agreement | |
| Conello © 2000-2003 Feedback | |
EAN: 2147483647
Pages: 217