Grouping Data
 |
| |||||||||
Grouping data means to organize it around a key value found in the data itself, for instance, grouping resorts by the country they are in or by the amenities they include. Groups do not exist as stored entities in a database, but instead Crystal or the database itself can perform the processing needed to associate a data record with a group for a more organized look at the data. By its very nature, grouped data is also data sorted either in ascending order (lowest to highest), descending order (highest to lowest), specified order (custom grouping), or original order (database storage order).
| Note | For more information on the four types of sort order, refer to the “Managing Groups” section in Chapter 2. |
As an example in this chapter, we’re going to work with a VistaNations report that shows the resort code, state or province, country, purchase price paid by owners for a unit in the resort, and the purchase date. In the VistaNations database, a resort code may be listed more than once if more than one resort unit has been sold. Figure 6.1 shows the beginning of this report, which is currently sorted alphabetically on resort code.
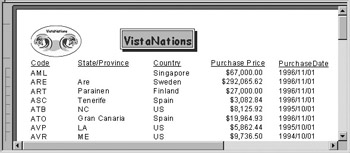
Figure 6.1. A sorted report
Creating Groups
Once a report is created in Design mode, there are several ways to add groups. Use any of the following methods:
-
Choose Insert > Group from the menu.
-
Click the Insert Group icon on the toolbar.
-
Choose Report > Group Expert from the menu.
-
Click the Group Expert icon on the toolbar.
The Group Expert and the Insert > Group approaches start out with slight differences but ultimately end up at the same dialog screen. With the Group Expert, you pick a field to group on using a list of available fields, as shown in Figure 6.2. This is the same dialog used to create groups using the Standard Report Creation Wizard.
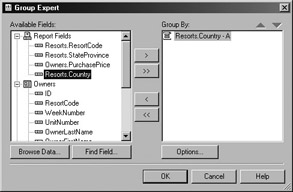
Figure 6.2. Group Expert
After you pick a field to group on, the Options button becomes available. When you click the Options button, the dialog used with the Insert > Group command or toolbar icon opens with one minor difference: With the Group Expert, the title bar says “Change Group Options” while with the Insert Group command, the title bar says “Insert Group.” So here you are, at the same place anyway! Figure 6.3 shows the Insert Group dialog.
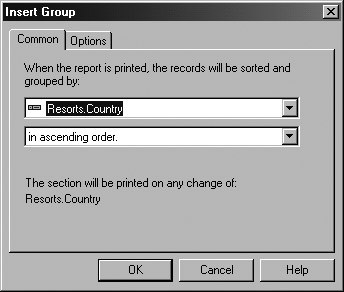
Figure 6.3. Inserting a group
The first drop-down box lets you choose or change the field on which the group will be based. If you selected a field in Design mode first and then used the menu or toolbar icon to insert a group, the field you chose is automatically placed in the first drop-down box. You can group on a field that exists in the report, a field from any of the tables available to the report, or a formula field that was previously created.
The sort order is specified in the second drop-down box, and you can choose from ascending, descending, specified, or original order.
Ascending Order Data is sorted lowest to highest; alphabet characters sort from A to Z, and numbers sort from 0 to 10 and higher.
Descending Order Data is sorted highest to lowest; alphabet characters sort from Z to A, and numbers sort from 10 or higher to 0.
Specified Order Data is sorted based on a customized criterion that does not exist in the raw data. This is also known as creating a custom group.
| Note | For a complete discussion of specified order, refer to Chapter 2. |
Original Order Data records are presented in the order in which they were added to the database.
Grouping on a Field
The easiest way to create a group is to use a field in the report. Just select the field, insert the group, choose a sort order, and you’re done! You can group on the field only once directly; however, by using a formula you can get creative if you need to group on the same field additional times. If you group on a field, you may want to delete the field from the Details section since the value from the field will now be a part of the group name.
The group name shown in a report defaults to the value of the field, and since the value of the field can change for each record, the name of the group is a variable and will change. For instance, if we group on Resorts.Country, the group name shown in the report will be the name of each country and a set of resorts belonging in that country will appear in the group. The group name will change from Andorra to Antilles to Argentina, etc. Crystal refers to this as a live header since the value changes according to the content of the data. The Options tab of the Insert Group dialog, shown in Figure 6.4, lets you control this default behavior by allowing you to choose another field as a group name or use a formula to hard-code a value for a group name or conditionally set a name with a formula.
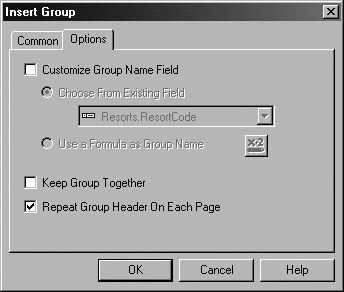
Figure 6.4. Setting group options
By default, the Group Header (which contains the group name) will not repeat on each new page if the group spans more than one page. You can override this default by enabling the Repeat Group Header On Each Page option. Since the Group Header is its own section, you can add and delete text, fields, images, etc., in it as you would with other sections. If the variable group name is not what you want, you can use a simple text object to create a group name that doesn’t change from record to record.
In addition, you can enable the Keep Group Together option if the data spans more than one page; this option forces a new page before starting a new group if the data in the group will take up more than one page. Figure 6.5 shows the result of the grouping based on the Resorts.Country field. Since grouping was done on a field in the Details section, that field has been manually deleted from the Details section to save screen real estate and clean up the report a bit.
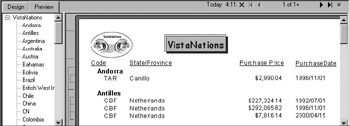
Figure 6.5. A report grouped on a field
Grouping on a Formula
A formula returns a value that can be used in a report. One of the purposes for the value is to group on it. Earlier we mentioned that you can be creative with formulas in order to group on a single field more than one time. To do this, just create a formula that returns the value of the field. For instance, if you already have a group created on the Country field, you can create a second group on the Country field by creating a formula with the following code:
WhileReadingRecords; {Resorts.Country} This formula simply returns the value of a field for each record in the database as it is being read from the database. More complex formulas will process the value in some way before returning the value. In our example report, we have a formula named @FirstLetterOfCountry that processes the Country field using the following code:
{Resorts.Country}[1] This single line of code returns the first letter of the value stored in the Country field by using the array subscript [1] (an array subscript of [2] would return the second letter in the field, [3] the third, and so on). You can insert a group based on this field, as shown in Figure 6.6.
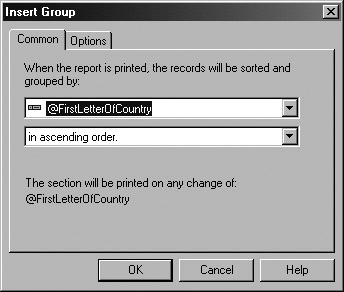
Figure 6.6. Choosing a formula for a group
Crystal automatically adds new groups below the existing groups; however, you can rearrange their order. Use a drag-and-drop technique in the Design tab to drag one group above or below the other by clicking its gray area section name.
Groups are also automatically left-aligned with the left margin. This is fine when there is only one group; with more than one group it is more aesthetically pleasing to indent groups slightly from one another to create a visual hierarchy. Since Crystal does not do this for you, you need to do it manually by selecting the group name and moving it to the right using the arrow keys on your keyboard one or two clicks; you can also use your mouse for the same task.. You may have to indent the field in the Details section as well. Figure 6.7 shows two groups in a nesting structure that have been manually indented. A Group Header and a Group Footer have been added for each group; in this depiction, the sections are showing short names instead of the complete section name.
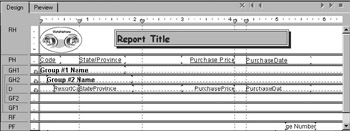
Figure 6.7. Manually indenting groups
Figure 6.8 shows the result in Preview mode. Notice that the group tree on the left clearly shows the hierarchy of data and allows you to navigate to a specific group very easily.
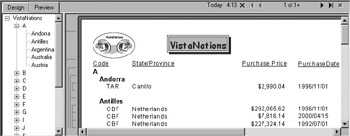
Figure 6.8. A report grouped on a formula
| Warning | Although formulas provide endless grouping possibilities, because the formulas are entirely evaluated and processed within Crystal, the performance aspect of your report may suffer. Crystal must first retrieve all the records from the database and then internally run the formula to group the data; this can be an intensive processing operation. As an alternative for better performance, consider using a stored procedure, SQL functions, or a SQL Command in the database to return data already grouped if the performance of your report suffers when Crystal does the formula grouping. The rule of thumb is to use the capabilities of the database whenever possible for complex processing. |
Grouping and Data Types
Since a group is created based on a field or a formula, the underlying field or formula has a data type that will affect the behavior and attributes of the group. The grouping dialog will automatically detect what type of data is in the field or being returned by the formula that you are using for grouping.
Text Data In prior releases of Crystal Reports, you could not sort or group on text fields larger than 255 characters. This restriction has been lifted in the newest release of Crystal Reports. Large text fields can now be used for grouping and in formulas.
Number Data Grouping directly on number fields (like AnnualSalary or AnnualSales) can be tricky because the data records may each contain unique, nongroupable values. Consider using a specified grouping to create a custom group that can help you group on a range or set of numbers instead of a specific number value.
Date or Date/Time Fields When you group on a date, time, or date/time field, Crystal presents additional grouping options specific to this type of data. Figure 6.9 shows the additional drop-down box provided for date data. The additional date options allow you to group the records in the report into meaningful buckets of dates.
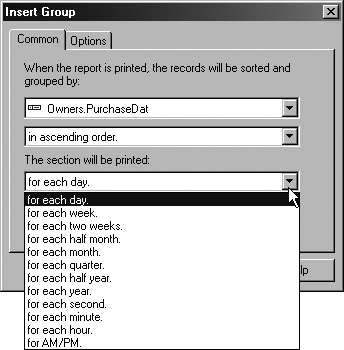
Figure 6.9. Grouping on a date field
Modifying a Group
An existing group can be modified, moved, or deleted. You modify a group in Design mode by right-clicking the group section name (gray part of screen) to display the context menu. From the menu, choose the Change Group option. This will open the same dialog shown in Figure 6.3, except that instead of inserting a new group you are modifying an existing group, so the title bar changes to Change Group Options. A group can be moved up or down in the list of sections in Design mode. Figure 6.10 shows the Group Header 2 and Group Footer 2 sections about to be dragged before Group Header 1. This will reorder the groups; however, if you manually indented the groups (as was done in this report), you’ll need to reindent manually after the groups are moved to their new positions.
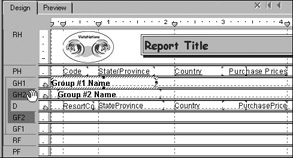
Figure 6.10. Moving or reordering a group
To delete a group, right-click the group’s section name and select the Delete Group option from the context menu. Again, any manual indenting that you added to the report will stay as it was, so you may want to reindent after deleting a group that was a part of a nested hierarchy.
Hierarchical Grouping
Some business relationship rules in a data source can exist within a single table. In the relational model, it is more typical to have relationships between fields in different tables rather than between fields within a single table. Crystal can report on both types of relationships. A typical example of a single table having this type of unique relationship between two fields in a table within the same data record is one that lists employee information using a unique EmployeeID for each record. In each record, one of the columns (attributes) of the record identifies the EmployeeID of the person’s manager, while this manager is also listed in the same table as an employee with a unique EmployeeID. This type of data is used to build an employee organizational chart to show who works for whom, and it is known as hierarchical data.
Hierarchical data exists when two fields within a single data record share a parent-child relationship with each other. The VistaNations report contains an example of hierarchical data in the RegionAreas table with a geographic relationship between ResortRegion and ResortArea, as shown in Figure 6.11.
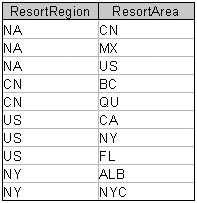
Figure 6.11. Hierarchical table
The data in the ResortArea column has a hierarchical or parent-child relationship to the data in the ResortRegion column; this is illustrated in Figure 6.12.
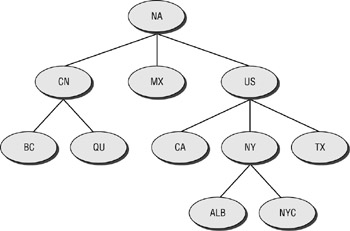
Figure 6.12. Hierarchical relationships
Crystal Reports has a built-in facility to help you build a report using this type of specialized data. The first step in displaying the hierarchy relationship in Crystal is to create a group based on the data that contains the relationship. In the case of ResortArea and ResortRegion, it is ResortArea that links back to ResortRegion, so the group is created on ResortArea. This group should be sorted in ascending order. After the group exists, you can choose Report > Hierarchical Grouping Options to create the hierarchy; the Hierarchical Options dialog appears, as shown in Figure 6.13.
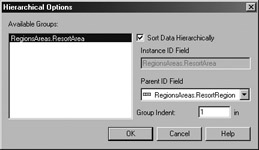
Figure 6.13. Hierarchical Options
Using this dialog, select a group from the set of groups that exist in the report. When you enable the checkbox option to Sort Data Hierarchically, the Parent ID Field area becomes available. Here, you choose the field that the grouped data (the child) is related to (the parent). You can also choose an indent size in inches for display purposes. The data is then sorted and indented based on the parent-child relationship between the two fields. The result of this type of data association is a visual representation of the hierarchical information, including the easy-to-read group tree representation. Figure 6.14 shows the start of a report with this type of grouping and the group tree to the left.
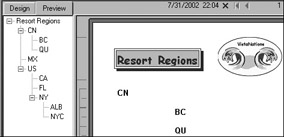
Figure 6.14. Hierarchical report with group tree
| Note | If a parent-child relationship doesn’t exist in the data for a record in a group, the record is sorted to the top of the hierarchy. |
Once the data is grouped hierarchically, you can add summary fields like subtotals and grand totals based on the hierarchy groups. For this type of summarization, you should choose the Summarize Across Hierarchy option, as shown at the bottom of Figure 6.15.
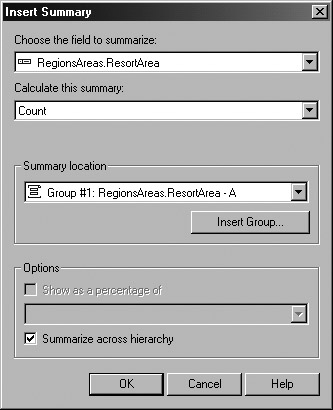
Figure 6.15. Summarize Across Hierarchy
Group Selection Formulas
Crystal contains two types of selection formulas: record selection and group selection. A group selection formula eliminates groups from a report based on a formula. To create a group selection formula, choose Report > Selection Formulas > Group. This opens the Formula Workshop - Formula Editor, where you can then type any formula that evaluates to a TRUE value. When the value of the formula is TRUE, then the group is included in the report; a value of FALSE eliminates the group from the report. In Figure 6.16, the formula returns a TRUE value if the first letter of the Resorts.Country field is not equal to the letter A. This will eliminate all countries from the report that start with A.
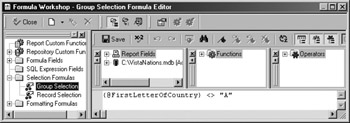
Figure 6.16. Coding a group selection formula
The statement does not have to be wrapped in a properly formatted IF-THEN-ELSE statement; all that needs to be present in a group selection formula is the condition clause of the IF portion of the IF-THEN-ELSE. When the clause is TRUE, the group is included in the report, and when it’s FALSE, the group is excluded. The result of this particular group selection formula on the VistaNations report is displayed in Figure 6.17.
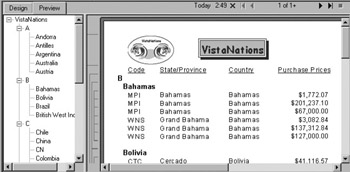
Figure 6.17. Group selection formula applied
Notice that the group tree still includes a reference to the countries that begin with the letter A. Clicking any of the A entries in the group tree, however, will not take you anyplace. The records do not exist in Crystal’s data set, but the group tree was created before the groups were filtered out of the report. The group tree is created during Crystal’s first pass through the data, while the group selection filter is applied in Crystal’s second pass through the data. Similarly, grand totals and group totals on groups are processed before the group selection filter is applied, which can throw off your totals; see the “Running Totals” discussion later in this chapter on how to deal with totals in a group when a group selection filter is being used.
| Note | For more information on Crystal’s processing engine passes, refer to Chapter 14, “The Report Engine Processing Model.” |
Special Fields for Grouped Data
As a part of the Field Explorer, the Special Fields category contains two fields specifically targeted to working with groups: Group Number and Group Selection Formula. Adding these fields to a report imparts information about the group’s position and value in the report. The special fields are shown in the Field Explorer in Figure 6.18.
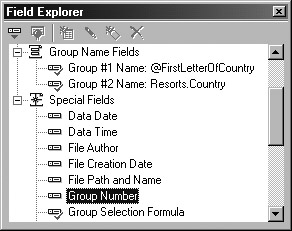
Figure 6.18. Special grouping fields
Also notice in the Field Explorer that any groups that have been added to the report appear in a special category called Group Name Fields. A green check mark next to the field name denotes that it has been used in the current report.
Group Number
As a part of the Group Header or Group Footer, the {Group Number} field is placed into a report to display a unique number for each group. The {Group Number} field increments from 1 to the last number for the group. It defaults to an integer value and can be further formatted using the Format Editor. This field can be placed multiple times into a report, once for each group in the report.
| Tip | For a variation on group number uniqueness, insert a text object and type a few text prefix characters (for instance, A-) and then add the Group Number field to the text object. This will result in group numbering like A-1, A-2, etc. |
Group Selection Formula
This special field provides a way for the group selection formula being used in the report to be displayed as part of the information in the report. You create and use the group selection formula itself by choosing Report > Selection Formulas > Group. You can display in your report the text of the formula coded in the formula window to create the selection criteria so that you can easily know which criteria are in effect. Since items placed in the Report Header and Report Footer appear only once in the report, these sections are a good place to position the special Group Selection Formula field to display the value in your report. If no group selection criterion is in effect, the value of the field is empty and nothing will display.
Grouping and summarizing data often go hand in hand, but in fact you can add summary information to a report without building it into a group. You can think of a summary as a display of a main point in the data records. In a report of total sales by salesperson, for instance, a summary point might be the total sales for all salespeople.
A summary can be created on a field or a formula in the report or a field in the data tables being used by the report. To add a summary to a report, use any of the following techniques:
-
Choose Insert > Summary from the menu.
-
Click the Insert Summary icon on the toolbar.
-
Right-click a field and select the Insert > Summary menu item.
All of the above actions display the Insert Summary dialog shown in Figure 6.19. When you choose the field to summarize on by right-clicking in the Design tab and then choosing Insert > Summary, the field is automatically placed in the first drop-down box as the field to be summarized. If this is not what you want, just use the drop-down box to pick a different field from the report, the formula list, or the tables in the report.

Figure 6.19. Inserting a summary
Types of Summaries
The second drop-down box in Figure 6.19 determines the kind of summarization that will take place. For selected fields of text or date types, the default is the Maximum function. For numeric fields, the default is the Sum function. Crystal provides a wide and powerful selection of summarization techniques, which are described in Table 6.1. If the summary you need to do is not listed in this table, you can write a formula to perform the specialized calculation using one of Crystal’s built-in formula languages. The data type of the field determines the list of summarization methods displayed for a field. The table contains the complete list of summarization techniques; the data types for Text, Boolean, date, and time values each present a pick list of techniques specific to the summarization methods valid to the data type.
| Summarization | Description |
|---|---|
| Sum | Adds all record values for the selected field. |
| Average | Calculates an average for the record values for the selected field. |
| Sample variance | Calculates a variance, which is the mean of the absolute values of the deviations from the mean for a selected sample of data; variance is the value of the standard deviation squared, which is [(Ex*Ex - n*m*m) / n] where n is the number of samples, Ex is the sum total of the samples, and m is the mean value of the samples where m = Ex / n. |
| Sample standard deviation | Calculates the standard deviation on a sample of data, which is a measure of the spread or dispersion of data using the formula square root [(Ex*Ex - n*m*m) / n] where n is the number of samples, Ex is the sum total of the samples, and m is the mean value of the samples where m = Ex / n. |
| Maximum | Given a set of values, returns the largest value. |
| Minimum | Given a set of values, returns the smallest value. |
| Count | A number representing how many times the value appears in the field. |
| Distinct count | A number representing how many times the value uniquely appears in the field. |
| Correlation with | Calculates the degree to which the values of a field vary. |
| Covariance with | Measures the relationship between two values and reports on how much they vary as a pair from the other values in the fields and how they track/trend together. |
| Median | Calculates the middle value in a distribution, below and above which lie values with equal total frequencies. |
| Mode | Given a set of values, returns the value that occurs the most frequently in the field. |
| Nth largest, N is: | Defines N as a number (e.g., 5), and from a set of values, returns the N largest values (in this case, 5 largest values). |
| Nth smallest, N is: | Defines N as a number (e.g., 7), and from a set of values, returns the N smallest values (in this case, 7 smallest values). |
| Nth most frequent, N is: | Defines N as a number (e.g., 9), and from a set of values, returns the N most frequently occurring values; similar to Mode. |
| Pth percentile, P is: | Displays the percentage of the calculation rather than the numerical value of the calculation. |
| Population variance | Estimates the variance, which is the mean of the absolute values of the deviations from the mean for the entire population of data. |
| Population standard deviation | Estimates the standard deviation on the entire population of data, which is a measure of the spread or dispersion of data. |
| Weighted average with | Calculates the average of one field and multiplies it by the value of another field. |
Placement of the Summary Value
After choosing a summarization method, you must specify the location to place the summary in the report in the Insert Summary dialog. Figure 6.19, shown previously, shows that the summary will be added to the Report Footer; this is the default location. Summaries placed in the Report Footer are grand total values and will incorporate all data records in the report. The following summarization methods are considered grand total calculations and generally involve all the data records in the report:
Average
Count
Distinct count
Maximum
Minimum
Population standard deviation
Standard deviation
Sum
Variance
If you don’t want the summary placed in the Report Footer, you can add it to a Group Footer using the drop-down list to choose from the list of existing Group Footers in the report. Summaries placed in a Group Footer are subtotal values and incorporate only the values within the group.
You can also create a group on the fly using the Insert Group button and add the summary you’re building to the new group. When the summary value is placed in a Group Footer, the check box option to show the value as a percentage of the whole becomes active. The default behavior is that the summary calculation displays as an actual number; the percentage option displays it as a percentage and compares it against the other values in the report.
Figure 6.20 shows the VistaNations report summarized with subtotals on the sum of purchase prices for each group and a grand total of all purchase prices at the end of the report. The text labels describing the summary values as well as the single and double-line separators were created manually in Design mode with text objects and line objects.
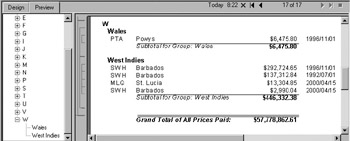
Figure 6.20. Summarized number fields
In prior versions of Crystal Reports, you could insert grand totals and subtotals directly from menu choices. In this release of Crystal Reports, both types of summaries are created somewhat more generically using the Insert > Summary approach. What determines whether they are grand totals or subtotals is in which section they are placed. To create a grand total, place the summary in the Report Footer; to create a subtotal, place the summary in the applicable group’s footer. The values are added to the footers without Grand Total or Subtotal labels, so be sure to add your own descriptive text describing the summary value.
Group Sorts
Once you’ve grouped and summarized data in a report, the Group Sort Expert becomes available to you for refining the data shown in the report. With this expert, you can reduce the number of records being shown in the report to concentrate on the important ones. Group sorts include Top N, Bottom N, Top Percentage, and Bottom Percentage. Choosing Report > Group Sort Expert opens the dialog shown in Figure 6.21.
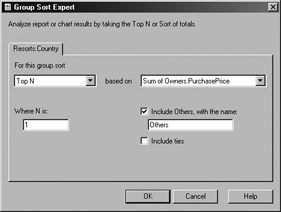
Figure 6.21. Group Sort Expert
Note the check box labeled Include ties. Enable this option to tell Crystal that when multiple groups have exactly the same summary value, include all the equal groups in the report. This may mean that more than the N number of values you asked for will display, but the advantage is that the tied values will all be present in the report. Figure 6.22 depicts the process of selecting out the top set of records or bottom set of records from the data that exists in Crystal. All the records still exist in Crystal; they are just being concealed in this report.
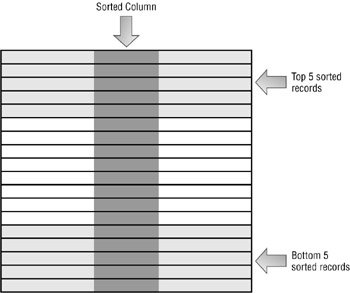
Figure 6.22. Top and Bottom N reporting
Using the dialog shown in Figure 6.21, you can set the N value to determine how many of the groups should display. N is a number that is specified by the report designer and can be any positive integer value. For the report in Figure 6.23, an N value of 1 was chosen. Compare Figure 6.23 to Figure 6.20. Both figures present the group of resorts that start with the letter W.
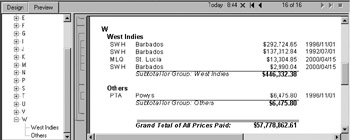
Figure 6.23. Top 1 with Others
Notice that the Others designation has replaced the specific reference to the Wales data. A Top N sort with the value of N set to the integer 1 displays the group with the highest total purchase prices only, which was the West Indies. The Others category was included in the report based on the Include Others with the name check box visible in Figure 6.21. Checking this option pushed all non-Wales data into a group called Others; unchecking the option will still filter the non-Wales data out of the W category and will additionally exclude it completely from the report. This is demonstrated in Figure 6.24; the Others group is not in report.
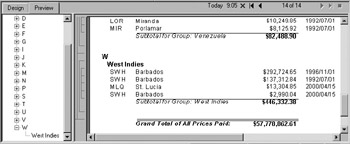
Figure 6.24. Top 1 without Others
Hang on! We’re leading up to a very interesting plot twist. Compare the grand totals shown in Figure 6.20, Figure 6.23, and Figure 6.24. They are all identical: $57,778,862.61. However, we just finished discarding the groups that weren’t in the Top N. Why are the numbers the same? Shouldn’t the grand total have updated? The grand total was calculated before you eliminated the groups, so its value remains unchanged; it is totaling all the records in the report including the ones that were eliminated with the Others option. The built-in summarization techniques provided by Crystal are working as designed; the nuance is that summaries process before many other steps in the report are complete. Basically what we have here is a timing problem involving when summaries are processed as compared to other report elements. The solution to this timing problem lies in a different type of summary object, running total fields. The grand total summary added here totals all records; what you need is a running total that summarizes only the groups being displayed in the report.
Running Totals
Grand total and subtotal fields are the perfect solution to coming up with a number to represent summarized report data; the calculations are preprogrammed for you and are easy to use. Sometimes, though, you need the ability to create totals on fields or calculations that are beyond the built-in summarization formulas. To go beyond the built-in routines, running totals are the answer.
Running totals are formulas that you create to accumulate values, counting up as records are processed by the formula. Since you code the formula yourself, you control how the total is calculated as well as what triggers it to reset to zero and start incrementing anew. An example of a running total that ties into our VistaNations resort-tracking database is building a total to count the number of five-star resorts in a particular place, like the New York State, while still displaying the entire list of resorts. To do this, you need a conditional formula that tests the value of the fields {Resorts.StateProvince} and {Resorts.FiveStarRating}, incrementing a variable by one whenever the fields equal NY and True, respectively. This type of conditional counting is impossible with the built-in summarization fields provided by Crystal.
Running totals provide the flexibility and power of formula language to allow any combination of logic to be used in an increment calculation. Among the things that running totals can be used to do are:
-
Increment a variable by examining records as they are read
-
Total values within a grouping but separate from the group total
-
Perform conditional incrementing of a variable to add to a total
-
Create a total after a group selection formula filters the data
When to Use Running Totals
You’ll know its time to use a running total when you preview a report and the result of a grand total or subtotal just doesn’t make sense given the data being displayed. This was the case earlier in this chapter when you compared the grand totals in Figure 6.20, Figure 6.23, and Figure 6.24 and realized that they shouldn’t be the same but were. Crystal’s built-in summarization formulas return results based on evaluating all the records that were returned from the database for the report. There are several cases, however, when this will return misleading totals:
-
Top and Bottom N sorts
-
Group selection formulas
-
Custom groups that exclude Others from the report
A Top N report conceals records that were returned by the data query but that are not part of the top or bottom slices of data. The entire data set still exists in Crystal, but Crystal is displaying only the ones you want to see. Top N is a great example of a report that needs running totals in order to calculate totals for just the displayed records rather than relying on the grand total built into Crystal. Crystal’s grand total, subtotal, and summary fields build totals based on the data set in memory. For Top N, that includes all the records, not just the displayed ones. So if you do a grand total on the sorted sales figures for the year and put it on a Top N report showing the sales for the top five sales people, the grand total field will display the grand total for all salespeople and not just the top five. In order to show a total number for just the top five people, a running total is needed to create a meaningful subtotal to accumulate just the values you specify. To correctly arrive at summary information just for the records in the Top N, you need to create separate totals, or running totals, in Crystal. Running totals are values that are arrived at by incrementing a counting variable based on criteria you define.
Group selection is another example of a type of data reduction that conceals data, creating the need for running totals. Group selection prevents groups of records from displaying in a report. The records that are concealed, however, are still included by Crystal in the set of records on which grand totals, summaries, and subtotals are based.
Custom groups can exclude data records that do not fit into the criteria for the custom groups. If you choose not to display the records that are outside the custom criteria, totaling fields can be misleading. Running totals should be used in place of built-in totals to correctly reflect the summarization numbers.
Creating Running Totals
To create a running total field, use the Field Explorer to highlight the Running Total Fields entry and then click the New button, or right-click to expose the submenu that contains the New option. Figure 6.25 shows the Field Explorer as you’re about to create a new running total field.
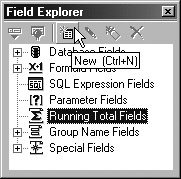
Figure 6.25. Creating a running total field
After you select New, the Create Running Total Field dialog shown in Figure 6.26 displays. This dialog is also known as the Running Total Expert. At the top right of the dialog, you type a name for the running total formula; this name will later appear in the Field Explorer’s list of formulas and fields.
| Tip | It is handy to leave the prefix set as RTotal on the front of the formula name so that you can easily identify it as a running total field when looking at a report. |
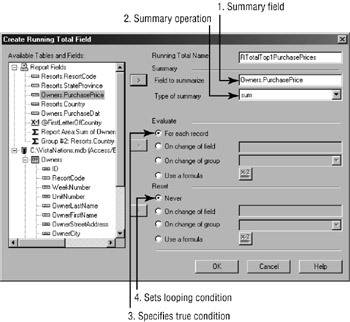
Figure 6.26. Running Total Expert
The dialog allows you to specify the criteria needed to calculate the running total by using the following steps:
-
Select the field on which to base the summary.
-
Choose the summary operation to apply.
-
Specify the true condition that determines when the summary should be applied.
-
Set a looping condition to tell Crystal when to reset the evaluation within the criteria.
When you specify a true condition for the evaluation, you can simply choose to evaluate for every record, field, or group, or you can use a formula. You would require a formula for the example mentioned earlier to count five-star resorts in NY; here’s the code you would put behind the formula button:
{Resorts.StateProvince} = "NY" and {Resorts.FiveStarRating} = True Once the Create Running Total Field dialog is filled out properly and closed, the field is available in the Field Explorer under the Running Total Fields category. From here, you can drag and drop it into the report in an appropriate position. As with all fields in a report, the section in which the field is placed affects how the field is evaluated. For Figure 6.27, the RTotalTop1PurchasePrices field has been placed in the Report Footer just above the grand total field so that the difference between the two numbers is clearly visible.
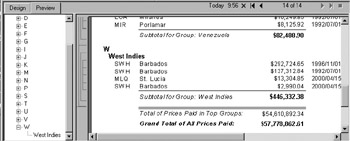
Figure 6.27. A running total result
The RTotalTop1PurchasePrices field needs to examine every record in the Details section, so it needs at the minimum to be placed in a section that follows the Details section. The Report Footer is an appropriate place for the new field since the Report Footer section immediately follows the Details section and comes before the Page Footer. If the field was placed in the Report Header, only first record in the report would be evaluated, which would return an incorrect total since the remaining records would not have been processed by the formula. Table 6.2 describes the effect of placing a running total in a given section and uses the assumption that the running total is not reset at any point in the report.
| Section | Records Evaluated By Running Total Fields |
|---|---|
| Report Header | Running Total is comprised only of the value in the first database record. |
| Page Header | For each page, the Running Total includes all records processed on prior pages plus the first record on the current page. |
| Group Header | For each group, the Running Total includes all records in prior groups plus the first record in the current group. |
| Details | For each record, the Running Total includes all records in prior to and including the current record. |
| Group Footer | For each group, the Running Total includes all records in prior groups plus all records in the current group. |
| Report Footer | Running is comprised of all the records in the report. |
| Page Footer | For each page, the Running Total includes all records processed on prior pages plus all the records on the current page. |
Running total fields are processed early in the report-processing cycle; refer to Chapter 14 for a detailed explanation of the order of evaluation of report elements.
| Use of content on this site is expressly subject to the restrictions set forth in the Membership Agreement | |
| Conello © 2000-2003 Feedback | |
EAN: 2147483647
Pages: 217