4.7 Subjectivity and Bias
4.7 Subjectivity and Bias
Subjectivity creeps into estimates in the form of optimism, in the form of conscious bias, and in the form of unconscious bias. I differentiate between estimation bias, which suggests an intent to fudge an estimate in one direction or another, and estimation subjectivity, which simply recognizes that human judgment is influenced by human experience, both consciously and unconsciously.
As far as bias is concerned, the response of customers and managers when they discover that the estimate does not align with the business target is sometimes to apply more pressure to the estimate, to the project, and to the project team. Excessive schedule pressure occurs in 75% to 100% of large projects (Jones 1994).
As far as subjectivity is concerned, when considering different estimation techniques our natural tendency is to believe that the more "control knobs" we have on an estimate—that is, the more places there are to tweak the estimate to match our specific project—the more accurate the estimate will be.
The reality is the opposite. The more control knobs an estimate has, the more chances there are for subjectivity to creep in. The issue is not so much that estimators deliberately bias their estimates. The issue is more that the estimate gets shaded slightly higher or slightly lower with each of the subjective inputs. If the estimation technique has a large number of subjective inputs, the cumulative effect can be significant.
I've seen one example of this while teaching several hundred estimators to use the Cocomo II estimation model. Cocomo II includes 17 Effort Multipliers and 5 Scaling Factors. To create a Cocomo II estimate, the estimator must decide what adjustment is needed for each of these 22 factors. The factors adjust for whether your team is above average or below average, whether your software is more or less complex than average, and so on. In theory, these 22 control knobs should allow virtually any estimate to be fine-tuned. In practice, the control knobs seem to introduce 22 chances for error to creep into the estimate.
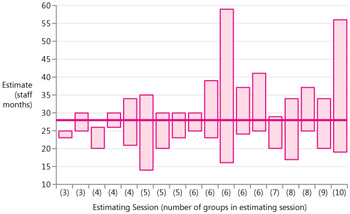
Figure 4-6 shows the ranges of results of about 100 groups of estimators applying Cocomo II's 17 Effort Multipliers to the same estimation problem. For each bar, the bottom of the bar represents the lowest group estimate in a session and the top of the bar represents the highest group estimate in a session. The total height of the bar represents the variation in the estimates.

Figure 4-6: Example of variations in estimates when numerous adjustment factors are present. The more adjustment factors an estimation method provides, the more opportunity there is for subjectivity to creep into the estimate.
If the estimation technique produced consistent results, we would see a tight clustering of results along the horizontal blue bar (the average of all the estimates). But, as you can see, the variation among the estimates is enormous. The total variation from highest to lowest is a factor of 4. The average variation from the low group to the high group within any one session is a factor of 1.7.
An important aspect of this data is that this particular estimation exercise is free of external bias. It occurs in an estimation class in which the emphasis is on accuracy. The only bias that is affecting these estimates are the biases inherent in the estimators' experiences. In a real estimation situation, the range of results would probably be even greater because of the increased amount of external bias that would affect the estimates.
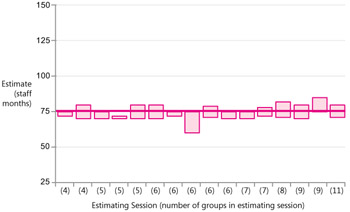
In contrast, Figure 4-7 illustrates the range of estimation outcomes with an estimation technique that includes only one place to insert a subjective judgment into the estimate—that is, one control knob. (The control knob in this case is unrelated to the Cocomo II factors.)

Figure 4-7: Example of low variation in estimates resulting from a small number of adjustment factors. (The scales of the two graphs are different, but they are directly comparable when you account for the difference in the average values on the two graphs.)
As you can see, the variation in these results is dramatically smaller than the variation when there are 17 control knobs present. The average variation from the low group to the high group within any one session is a factor of only 1.1.
The finding that "more control knobs isn't better" extends beyond software estimation. As forecasting guru J. Scott Armstrong states, "One of the most enduring and useful conclusions from research on forecasting is that simple methods are generally as accurate as complex methods" (Armstrong 2001).
| Tip #21 | Avoid having "control knobs" on your estimates. While control knobs might give you a feeling of better accuracy, they usually introduce subjectivity and degrade actual accuracy. |
EAN: 2147483647
Pages: 212