Cisco IOS Diagnostic Commands
Cisco IOS commands are built in with the software and provide both basic and high-level troubleshooting. Using these commands, you can gather information about the state of the network and devices. This data helps identify potential network performance bottlenecks and decide a corrective action to remove these bottlenecks. However, a major drawback of the Cisco IOS commands is that they consume a significant amount of resources and lead to deterioration in the performance of routers. As a result, these commands need to be properly planned and should be used only on a temporary basis.
There is a wide range of show and debug commands, which can be used for viewing status information and debugging at the event or process level. In addition, the ping and trace commands are available for checking connectivity and routing status over heterogeneous networks.
The Show Command
Cisco provides various IOS commands that display the status of routers, their interface, and utilization of router resources. In addition, the show commands enable isolation of network faults and monitor network behavior during installation and redesign. The functions performed by show commands are:
-
Isolate faults related to applications, interface, nodes, and media
-
Display router behavior during initial installation
-
Monitor the network for congestion
-
Monitor day-to-day operations of the network
-
Provide status updates for servers and clients
Some of the commonly used show commands for troubleshooting are:
Show version: Displays details such as the system hardware configuration, software version, names and sources of configuration files, and boot images.
Show running-config: Displays the current router configuration.
Show startup-config: Shows the router configuration stored in NVRAM.
Show interfaces: Displays statistical data about all the interfaces configured on the router or access server.
Show controllers: Views the statistics of the interface card controller.
Show flash: Provides the layout and content of flash memory.
Show buffers: Shows data for buffer pools on the router.
Show memory summary: Displays the memory pool statistics and summary information about the system memory allocator and provides a block-by-block listing of the memory use.
Show process cpu: Provides information about processes that are active on the router.
Show stack: Shows information about the utilization of processes, and interrupts routines and provides information about the reason for the last system reboot.
Show cdp neighbors: Displays information about the degree of reachability of directly connected Cisco devices. This is a Cisco-proprietary command that assists in determining the operational status of the Physical and Data-link layers.
Show debugging: Displays information about the type of debugging that is enabled for a router.
Like the debug commands, some of the show commands listed are accessible only at the privilege exec mode (enable mode) of the router. Table 4.1 displays the show commands and the services of each command.
| Command | Service |
|---|---|
| access-lists | Lists the access lists of the routers |
| arp | Displays the ARP table |
| cdp | Displays the CDP information |
| clock | Displays the system clock |
| configuration | Displays the contents of the nonvolatile memory |
| controllers | Displays the interface controller status |
| flash | Displays information about the flash filesystem |
| frame-relay | Displays information about the Frame Relay |
| history | Displays information about the session command history |
| hosts | Displays the domain name, nameservers, and the host table |
| interfaces | Displays the interface status and configuration |
| ip | Displays information about IP protocol |
| ipx | Displays information about the Novell IPX protocol |
| isdn | Displays information about ISDN |
| ntp | Displays information about the Network Time Protocol (NTP) |
| protocols | Displays information about the currently active network routing protocols |
| running-config | Displays the current operating configuration |
| sessions | Displays information about the TELNET connections |
| startup-config | Displays the startup configuration |
| terminal | Displays the terminal configuration parameters |
| users | Displays information about the terminal lines |
| version | Displays information about the hardware and the software of the system |
The Debug Command
The debug command provides detailed information about network traffic on an interface. It also provides error messages generated by nodes along with information about protocol-specific diagnostic packets. Debug commands run in the privilege exec mode of the CLI. However, as stated earlier, this tool needs to be used with caution to minimize the impact on the network. This means that you should use debug commands only for detecting and isolating network problems and not for day-to-day monitoring of network statistics. Debug commands are usually processor intensive, which increases the CPU utilization tremendously and has a negative impact on network performance. This occurs when the network router is preloaded with other tasks.
The adverse impact of debug commands can be avoided by following certain guidelines:
-
Before using the debug command, use the no logging console global configuration to prevent other users from logging on to the console.
-
Executing the debug command at the console port generates character-by-character interrupts, which increases the processor load. To prevent this, it is recommended that you use Telnet to access the privilege exec mode and the terminal monitor command to copy the output of the debug command to the current terminal. This enables remote viewing of the debug command output without connecting to the console port.
-
Spool the output to a file to save the debug command output.
-
Before using the debug command, check if network traffic is at its peak. Execute the command when the network traffic is not at its peak so that the data packet transmission is not hampered.
-
Disable the command after the debugging process is over. To disable a particular debug command, execute the no debug command. You can also disable all types of debugging commands by using the no debug all command.
The output of the debug command differs depending on the type of debug command that is executed. While some debug commands generate a single line of output, others provide multiple lines of output per packet. Using the debug command, you can debug almost all networking features. Table 4.2 displays some the services that use the debug command:
| Command | Service |
|---|---|
| nbf | NetBIOS |
| arp | ARP and HP probe transactions |
| lapb | LAPB transactions |
| cls | CLS |
| apollo | Apollo |
| domain | Domain Name System (DNS) |
| broadcast | MAC broadcast packets |
| aps | Automatic Protection |
| cbus | CiscoBus events |
| ipx | IPX |
| atm | ATM signaling |
| llc2 | LLC2 type II |
| nhrp | NHRP |
| callback | Callback activity |
| sna | SNA |
| modem | Modem activation |
| clns | CLNS |
| serial | Serial interface |
| compress | COMPRESS traffic |
| dhcp | DHCP client activity |
| custom-queue | Custom output queueing |
| decnet | DECnet |
| ipc | Interprocess communications |
| dialer | Dial on Demand |
| token | Token Ring |
| dnsix | Dnsix |
| lnx | qllc/llc2 conversion |
| cdp | CDP information |
| dxi | ATM-DXI |
| eigrp | EIGRP |
| x25 | X.25 |
| ethernet-interface | Ethernet network interface |
| translate | Protocol translation |
| filesys | Filesystem |
| sscop | SSCOP |
| fras | FRAS Debug |
| ip | IP |
| stun | STUN |
| adjacency | Adjacency |
| isis | IS-IS |
| kerberos | KERBEROS |
| lane | LAN emulation |
| access-expression | Boolean access expression |
| lat | LAT |
| ppp | PPP |
| sdllc | SDLLC |
| local-ack | Local acknowledgment |
| async | Async interface |
| mop | DECnet MOP server |
| chat | Chat scripts activity |
| ntp | NTP |
| tacacs | TACACS |
| pad | X.25 PAD |
| lex | LAN extender |
| source | Source bridging |
| probe | Probe proxy requests |
| radius | RADIUS |
| rif | RIF cache |
| sdlc | SDLC |
| packet | Log unknown packets |
| confmodem | Modem configuration database |
| telnet | Telnet connections |
| smrp | SMRP |
| channel | Channel interface |
| xremote | XREMOTE |
| snmp | SNMP |
| frame-relay | Frame Relay |
| spanning | Spanning tree |
| dspu | DSPU |
| standby | Hot standby |
| fastethernet | Fast Ethernet interface |
| vlan | VLAN |
| tarp | TARP |
| tbridge | Transparent bridging |
| v120 | V120 |
| tftp | TFTP |
| apple | AppleTalk |
| entry | Incoming queue entries |
| tunnel | Tunnel information |
| priority | Priority output queueing |
| vg-anylan | VG-AnyLAN interface |
| vines | VINES |
| snapshot | Snapshot activity |
| dlsw | Data Link Switching events |
| xns | XNS |
| smf | Software MAC filter |
| Note | Regardless of the precautionary conditions applied while debugging, it is advisable to use third-party tools for troubleshooting, especially when you need to gather information about protocols. A more feasible alternate for gathering information about protocols is a third-party protocol analyzer. |
The Ping Commands
The ping command is used to monitor host reachability and connectivity over a network. The command can be executed from the user and privilege exec modes. In the user exec mode, ping allows connection with remote devices, basic level testing, and temporary modification of terminal settings.
The ping command checks basic network connectivity for AppleTalk, IP, Novell, Apollo, ISO Connectionless Network Service (CLNS), VINES, DECnet, or XNS network.
In the case of IP, the ICMP echo messages are sent by the ping command to check the interconnectivity among hosts in a network. If a problem occurs while echoing packets, ICMP reports errors and provides relevant information pertaining to IP packet addressing. For example, Figure 4.4 shows the output of a successful ping command, when ICMP successfully echoes the data packets.
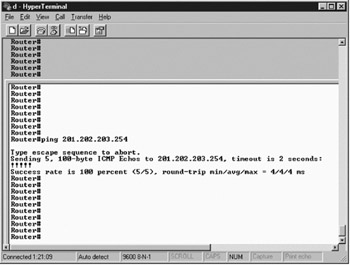
Figure 4.4: Output of a successful ping command echoing data packets.
The privilege exec mode allows you to specify the supported IP header options, which enable routers to perform detailed testing.
In the initial stages, some echo messages may timeout due to the need for setting the Address Resolution Protocol (ARP). The ping command works on a round trip path, in which the destination node sends a reply to the echo message, sent from the source node. While troubleshooting, do remember that the ping command
usually fails because the destination host does not find a path to send a reply to the echo message.
The Trace Command
The trace command determines the routes taken by data packets that are transmitted from the source to the destination host. This command receives the error messages generated by routers when the datagram exceeds its TTL and provides the appropriate remedial action.
For example, you can use the trace diagnostic command to identify the route from the host to a specified IP address. Figure 4.5 shows the output of a successful trace command.
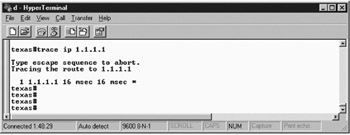
Figure 4.5: The trace diagnostic command showing its output.
The initial probe datagrams are transmitted with a TTL value of 1. The first router discards the probe datagrams and sends back a Time Exceeded error message. After this, the trace command sends a number of probe datagrams and displays the time of the round trip, increasing the TTL value by 1 after every third probe.
An outgoing datagram can receive two types of error message:
Time exceeded: Is generated when an intermediate router has seen and discarded the probe datagram.
Port unreachable: Is generated when the destination host receives the probe datagram and discards it because it could not be passed to any application.
The trace command is terminated when the destination host responds or the maximum TTL limit is exceeded. In addition, the trace command is terminated when it is interrupted using the escape sequence.
EAN: 2147483647
Pages: 130