Planning
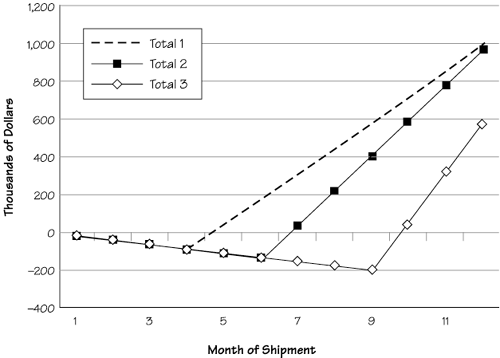
PurposeThis exercise gives participants experience in project planning. A project is planned using three different methods, with each method producing a substantially better plan. Description (Part 1)The participants were told that they are in charge of planning a very important project. The project has to be completed in six months. The project has 45 critical features, which are represented by 45 small cards. The cards have the number of the feature (1 to 45) in the center of the card. The cards also have other numbers in each corner of the card, but these numbers are not explained. The participants are told to lay the cards out in six columns, where each column represents one month of the project. EventsThis part of the tutorial was always chaotic. The participants wanted to know what the other numbers meant. Everyone seemed to have a hard time deciding what to do. The participants were always looking for the secret. After the instructors repeatedly refused to tell them what the other numbers meant, the participants finally managed to get the cards on the table in six columns. The groups spent a lot of effort trying to find the best plan. Some groups used numeric order. Some groups tried a wedge shape, where they plan to get less done in the first month but gradually increase productivity. Some groups tried to use the other numbers on the card. The number of different approaches was a testament to their creativity. Once every group had a plan, the instructors went around to each table and told the group how much work they completed during the month. We used an incredibly complicated algorithm, but it always had the same effect. The group did not manage to get all the work done that they planned to complete. The cards that were not done were removed from the first column. These cards needed to be worked into the remaining five months. This was repeated for two more iterations. The participants became really frustrated by this exercise. They were attempting to get work done, but they always had cards that were not completed. Finally, when they were just about ready to lynch us, we told them the secret. Description (Part 2)Planning a project is hard when you don't know the cost of a feature. The instructors had been using the small numbers on the right side of the card to determine the cost of the feature (how long it takes to implement). We randomly decided to use either the upper number or the lower number, but it didn't matter which one we picked. Each group had been completing ten units of work per month. Now that the groups know the cost of the features and how many features they can complete in a month, they create another project plan. Management (in this case, the instructors) still wants the project in six months, but each group gets to pick their project ship date. EventsOne of the first things every group did is to figure out that it is impossible to get all 45 features done in six months. It would take nine months to complete all the features. The project plan was much better than the previous plan because they had information about how much work they could get done and when the project would be completed. In this version of the exercise, we let each group decide in which iteration they wanted to ship the project. Some groups would ship at the end of the full nine months; others would ship sooner. Once everyone chose a ship date, we told the groups the second secret: The numbers on the left side of the card represent the value of each feature. Using the value numbers, each group announced how much business value they shipped. We then displayed a simple spreadsheet and graph that showed the results. We assumed that the development costs for each group were $20,000 per month. The values of the features were in thousands of dollars. Then we showed what a profitability graph would look like for different ship dates. It was always surprising how well the groups did who shipped early. True, the ones who waited until the end finally won out, but shipping just once, early in the project, turned out to be a very good strategy. Figure 25.1 shows a sample of how three different ship dates impact profitability. All three groups have the same monthly development cost. Group 1 decided to ship after month 4. One month later, this group had recovered their development cost and started earning profits. Groups 2 and 3 waited until months 6 and 9 to ship. Although both of these groups shipped higher value than group 1, they also had higher development costs to recover. Figure 25.1. Early versus late shipment, unknown story value
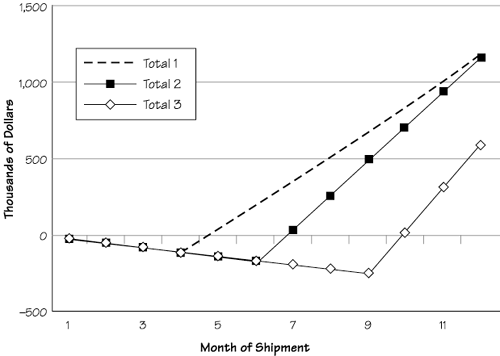
Description (Part 3)The second part of the planning exercise let the participants produce a better plan. However, it still isn't the best plan. Now that the groups know both the cost and the value of a feature, they can lay out the cards to produce the best possible plan. EventsNone of the groups had a problem figuring out which features to do first. They all decided to do the high-value, low-cost cards first. The project plans were very similar. However, the groups still did not agree when to ship their projects. The release dates still tended to vary. Some groups wanted to wait until they got everything done. Some groups wanted to ship earlier. We used the spreadsheet again in this part of the exercise. All the groups shipped a more valuable product except the group that waited until they had all the features completed. The profitability graph shown in Figure 25.2 is similar to the previous graph in Figure 25.1, except that the slopes for the groups that released in months 4 and 6 are a little bit steeper. Because both of these groups shipped with less than all the features, using this approach let them maximize the value of the features that they did complete. The group that shipped all the features in month 9 still eventually had the highest profitability, but shipping early was still a very good strategy. Figure 25.2. Early versus late shipment, optimal story value
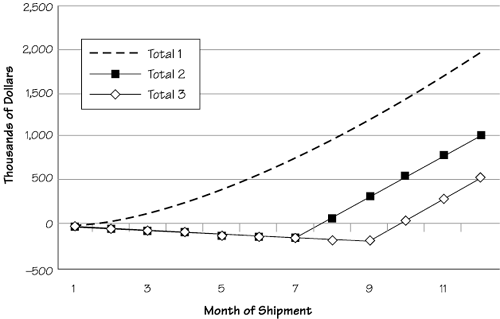
Description (Part 4)Knowing cost and business value enables the groups to produce the best possible plan. Then they need to figure out the best possible ship date. EventsIn the first three parts of this exercise, we allowed the participants to select only one ship date. In this part of the exercise, we let the participants experiment with multiple releases. Then we used the spreadsheet to show the impact on the profitability graph, shown in Figure 25.3. Figure 25.3. Incremental shipment, optimal story value
SummaryTo create an optimal project plan, you need to know the relationship between cost and business value. This exercise demonstrated a simplified version of project planning. We eliminated all the uncertainty. We knew exactly how much work each group could get done. We knew exactly how much each feature would cost. We knew exactly how much value each feature would provide. The bad new is that you won't know this exact information for your project. The good news is that it won't matter that much. Think about it. All you need is the ability to make comparisons between cards. This card is worth more than that card. This card is harder to implement than that card. Knowing the cost and value of a feature, relative to other features, is sufficient to let you create a good project plan. |
EAN: 2147483647
Pages: 445