16.2 Bifurcation and the Real Function f(x)x2 c
 | Java Number Cruncher: The Java Programmer's Guide to Numerical Computing By Ronald Mak |
| Table of Contents | |
| Chapter 16. Fractals |
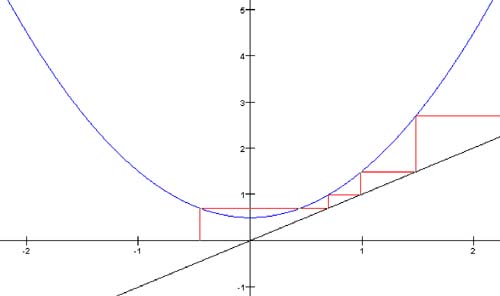
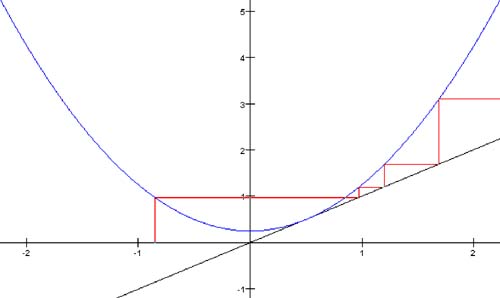
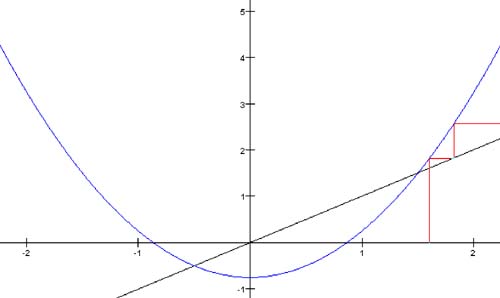
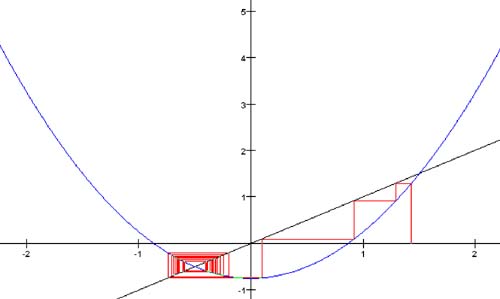
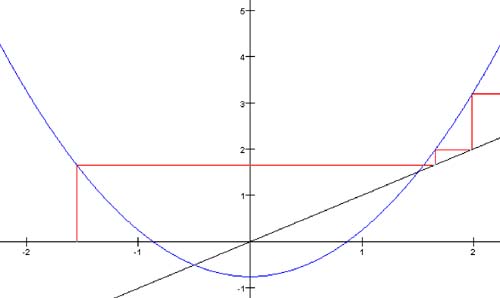
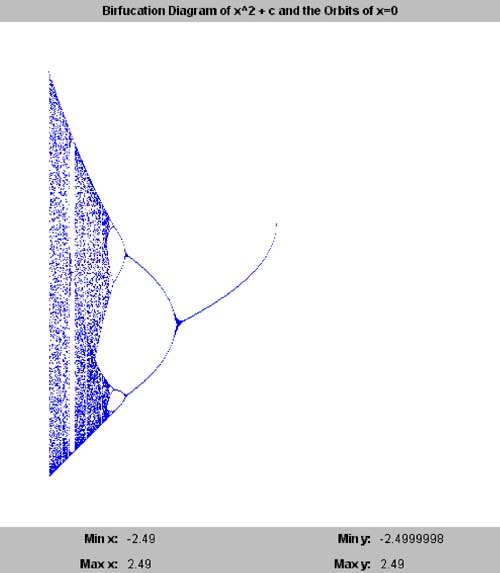
16.2 Bifurcation and the Real Function f ( x ) = x 2 + cFor the class of functions of the form f ( x ) = x 2 + c, where c is a constant, let's see what happens under fixed-point iteration. The plot of such a function is a parabola centered about the y axis, and different values of c simply move the parabola up or down the axis. As shown in Figure 16-0a, when Figure 16-0a. Fixed-point iteration of the function f(x) = x 2 + 0.5. When Figure 16-0b. Fixed-point iteration of the function f(x) = x 2 + 0.25. Finally, when Figure 16-0c. Fixed-point iteration of the function f(x) = x 2 - 0.75 with different starting x values. Thus, we see that the different values for c affect the behavior of orbits. Another way to examine this behavior graphically is to plot the orbits of only x = 0 for various values of c. For an iterated function, the value 0 is the critical point, and its orbit is the critical orbit. Program 16-1 plots the critical orbits, and Screen 16-1a shows its output. Screen 16-1a. The bifurcation diagram of f(x) = x 2 + c for -2 < c < +2 and the orbits of x = 0. In Screen 16-1a, the different values of c from -2 through +2 run along the horizontal axis. Above each value of c, the program plots vertically the values of the orbit of x = 0. Listing 16-1 shows class PlotThread of the program. [1] The constant MAX_ITERS is 200, so the program computes only the first 200 values of each orbit. Also, the constant SKIP_ITERS is 50. The program does not plot the first 50 values of each orbit it's interested only in each orbit's eventual behavior.
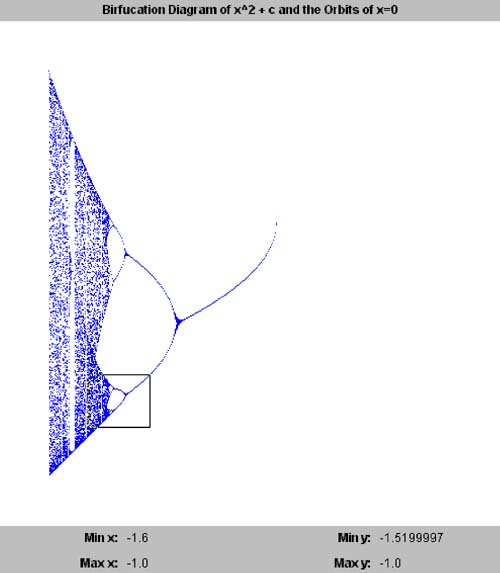
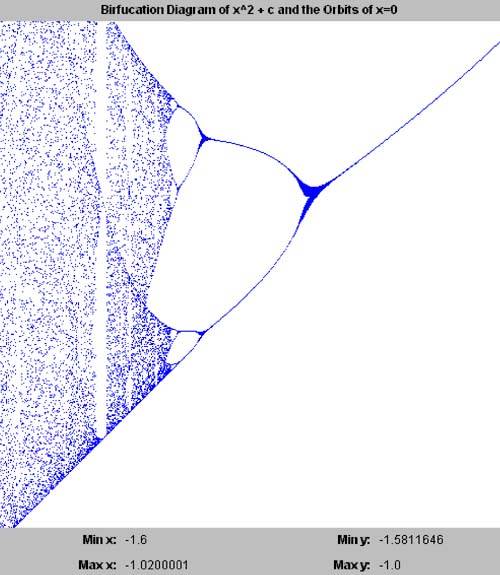
Listing 16-1 Class PlotThread of Program 16 C1, which plots the bifurcation diagram of the function f(x) = x 2 + c . private static final int SKIP_ITERS = 50; private static final int MAX_ITERS = 200;/** * Graph thread class that creates a bifurcation diagram of * the function f(x) = x^2 + c. For each value of c, it plots * the values of the orbit of x=0. */ private class PlotThread extends Thread { public void run() { // Loop over the horizontal axis. for (int col = 0; col < w; ++col) { float c = xMin + col*delta; float x = 0; for (int i = 0; i < MAX_ITERS; ++i) { x = x*x + c; if (i >= SKIP_ITERS) { float y = x; int row = Math.round((yMax - y)/delta); plotPoint(col, row, Color.blue); } } // Draw a row of the graph. drawPlot(); yield(); } } } The result is a bifurcation diagram, so-called because it shows how, for certain values of c, the orbit values split into two camps. "Holes" in the diagram indicate periodic orbits. As the value of c changes from left to right, the orbits change from being chaotic to periodic to stable. There is order even in the chaotic regions . The diagram is recursive if we "zoom in" on a rectangular region of the diagram, we see that this region of the graph is similar to the whole graph. This recursive behavior, or "self similarity," is the key characteristic of fractal images. The screen shots in Screen 16-1b show this. We use the mouse to drag a rectangle around a region of the diagram, and then the program redraws that region at a larger scale. Screen 16-1b. Zooming in on a rectangular region of the bifurcation diagram. Theoretically, we can continue zooming into the diagram indefinitely. But in this program, at the zoomed-in "higher resolutions ," the single-precision computations will have lost too many significant digits to be accurate. |
EAN: 2147483647
Pages: 141
- A View on Knowledge Management: Utilizing a Balanced Scorecard Methodology for Analyzing Knowledge Metrics
- Measuring ROI in E-Commerce Applications: Analysis to Action
- Technical Issues Related to IT Governance Tactics: Product Metrics, Measurements and Process Control
- Governing Information Technology Through COBIT
- The Evolution of IT Governance at NB Power