Section 18.2. Debugging
18.2. DebuggingBreak, Debug, Deduce, Fix, Inspect, Repair, Step, Test Figure 18-3. Debugging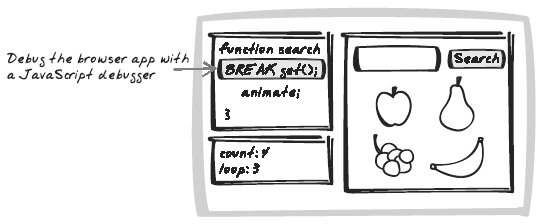 18.2.1. Developer StoryDevi is scratching her head, wondering why a particular visual effect is so jerky; instead of growing gradually, the icon transitions from small to large in just a few, erratic, steps. Code analysis is getting her nowhere, so she fires up her JavaScript debugger, which allows her to step through the effect in her own time. After adding the box dimensions to a watchlist, she quickly diagnoses the cause as a number-rounding issue. 18.2.2. ProblemHow can you diagnose errors and strange behavior? 18.2.3. SolutionDiagnose problems with a JavaScript debugger. JavaScript Debugging used to be as sophisticated as adding a few alert messages, but it has come a long way. A tool such as the Venkman debugger (http://www.mozilla.org/projects/venkman/), a popular Firefox extension, makes the point. Venkman has all the basic features you'd look for in a debugger of any language: breakpoints, call stacks, step in/out/over, watches, and error and exception triggers. Also, an interactive session lets you type code for immediate execution as well as basic profiling support.
For basic error reporting without a custom debugger, use Firefox's built-in JavaScript Console, and on IE, switch off the "Disable Script Debugging" options. You can also define window.onerror to show any errors that arise, as the event handler is notified of the error message, URL, and line number. You could then perform Logging or create an alert, e.g.: window.onerror = function(message, url, lineNum) { alert("Error: '" + message + "'. At " + url + ", Line " + lineNum); } 18.2.4. Tool Support18.2.4.1. VenkmanVenkman (http://www.mozilla.org/projects/venkman/) is an open source Firefox extension with quite sophisticated Debugging support, as discussed in the preceding Solution (Figure 18-4). When you open the debugger, it shows a list of JavaScript files, which you can then open to set breakpoints. Figure 18-4. Venkman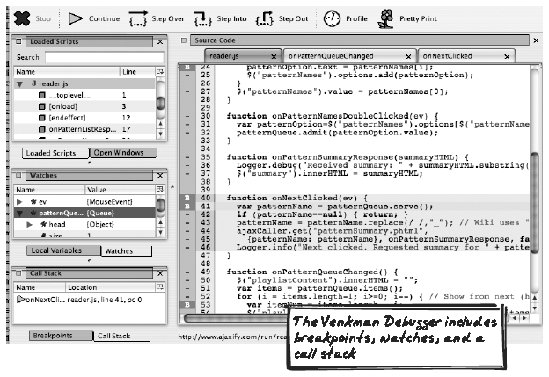 18.2.4.2. Microsoft Script DebuggerMicrosoft makes Microsoft Script Debugger (http://msdn.microsoft.com/library/default.asp?url=/library/en-us/sdbug/Html/sdbug_1.asp) available for no cost. It offers basic Debugging functions, e.g., breakpoints, a basic call stack, step in/out/over, and error triggers (Figure 18-5). While not as feature-rich as Venkman, it's still useful for investigating IE-specific bugs. The IE Blog (http://blogs.msdn.com/ie/archive/2004/10/26/247912.aspx) lists several options for IE Debugging. Figure 18-5. Microsoft Script Debugger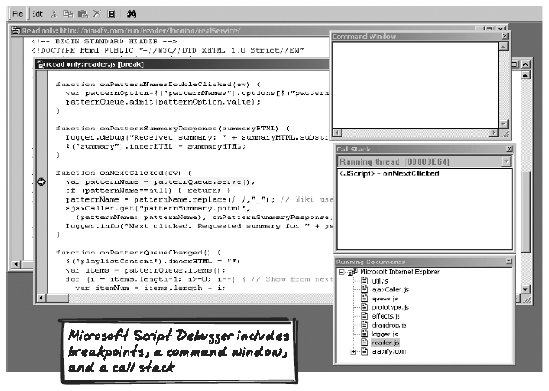 18.2.4.3. JavaScript HTML DebuggerJavaScript HTML Debugger (http://www.htmldebugger.com/javascript_debugger/javascript_debugger.asp) is a commercial tool from SplineTech. It's a standalone Windows application with functionality similar to Venkman but a greater emphasis on ease-of-learning. |
- ERP System Acquisition: A Process Model and Results From an Austrian Survey
- Enterprise Application Integration: New Solutions for a Solved Problem or a Challenging Research Field?
- Data Mining for Business Process Reengineering
- A Hybrid Clustering Technique to Improve Patient Data Quality
- Development of Interactive Web Sites to Enhance Police/Community Relations