What Excel Does
| Excel and Word are the two powerhouses of the Microsoft Office family. While Word lets you create and edit documents, Excel specializes in letting you create, edit, and analyze data that you organize into lists or tables. Sure, you could use a database program (like Microsoft Access) to create and work with your data, but in a lot of cases, using a spreadsheet is just plain easier. For example, Excel is perfect for creating things like:
These examples just scratch the surface, of course. Resourceful spreadsheet gurus use Excel to build everything from cross-country trip itineraries to lesson plans to scientific models. Here are three quick ways to tell whether you should use Excel for any given number-crunching project:
Excel spreadsheets look like big grids. You type your data into individual cells organized into columns (A, B, C, D, E, and so on) and rows (1, 2, 3, 4, 5, and so on). The spreadsheet in Figure I-1 shows a table of student grades. You'll notice it's organized as a list of nine students, each of whom has two test scores and an assignment grade. Using Excel formulas, it's easy to calculate the total grade for each student. But there's no need to stop there. With a little more effort, you can calculate averages, medians, and even determine which percentile each student falls into. Figure I-1. A typical spreadsheet is really just a table.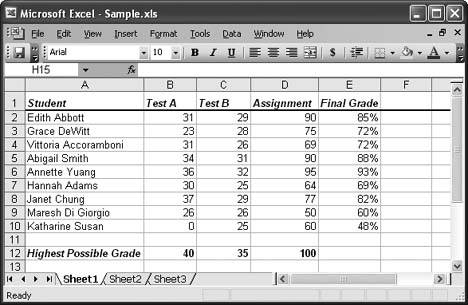 The bottom line is that once you enter raw information, Excel's built-in smarts can help you compute all kinds of useful figures. For example, Figure I-2 shows a sophisticated business spreadsheet that's been configured to help identify hot-selling products. In Figure I-2, you'll notice a summary of total sales for a company. The information is grouped by where the company's customers live and is further divided according to product category. Using a summary like this, you can quickly spot the product categories that make the most money and identify which items are popular in specific cities. Figure I-2. Sophisticated spreadsheets are not hard to create.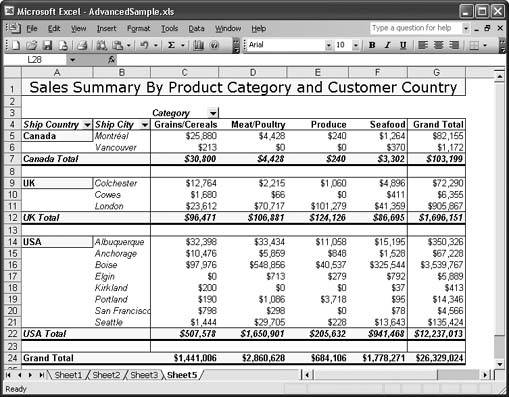 Excel's not just a math wizard; if you want to add a little life to your data, you can inject color, apply exotic fonts, and even create macros (automated sequences of steps activated by the click of a button) to help speed up repetitive formatting or editing chores. And if you're bleary-eyed from staring at rows and rows of spreadsheet numbers, you can use Excel's many chart-making tools to build everything from three-dimensional pie charts to more exotic scatter graphs. The spreadsheets and charts you create with Excel can be as simple or as sophisticated as you want them to be. |
EAN: 2147483647
Pages: 85
- Chapter I e-Search: A Conceptual Framework of Online Consumer Behavior
- Chapter III Two Models of Online Patronage: Why Do Consumers Shop on the Internet?
- Chapter VII Objective and Perceived Complexity and Their Impacts on Internet Communication
- Chapter XI User Satisfaction with Web Portals: An Empirical Study
- Chapter XVIII Web Systems Design, Litigation, and Online Consumer Behavior