Report Layouts
| SSRS has three report layout options for developers to choose from during the design phase: tabular (top-down, row-by-row, column aligned output), matrix (top to bottom and left to right, column- and row-aligned output), and free-form. Developers can combine various layouts on a single report. More detailed discussion about report layouts is available in Chapter 11, "Working with Report Items." The report presented in Figure 2.1, taken as a whole, has a combination of layouts: free-form and tabular. Figure 2.1. Tabular and free-form layout.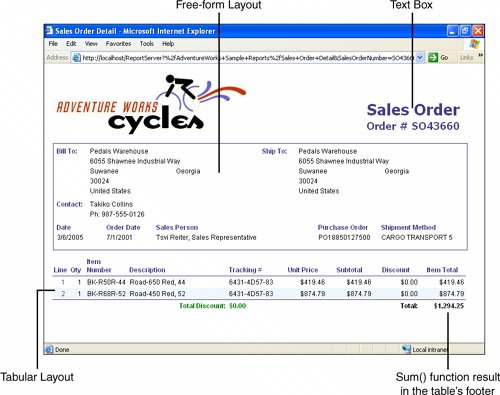 Tabular Report LayoutThe tabular report layout is designed to display column-based data. This type of report is very similar to the way data is presented in a Microsoft Excel worksheet. In the tabular report, developers can group and summarize data using aggregate functions. Aggregate functions include Sum , Avg , Min , Max , and Count . Tabular report layout propagates from top to bottom, row-by-row and allows grouping rows. Using a Table data region is the most common way to generate the tabular report layout. Unlike a table, a list does not provide item alignment; however, this type of layout could also be created using a list. Figure 2.1 includes a tabular layout. A large portion of reports are developed in a tabular layout. Free-Form Report LayoutAs the name implies, free-form layout can contain repetitive or nonrepetitive data; items can be free-form, grouped, nested within each other (providing multiple levels of grouping), and/or located side by side. Much like a Microsoft Office document, a report contains three main areas: the body (the main informational content of a report), a page header (the information that repeats at the top of each page of a report), and a page footer (the information that repeats at the bottom of each page of a report). A header and a footer can contain a limited subset of report items: images, text boxes, and lines. A report's body can contain any report item. Each report area serves as a free-form container in that it allows you to place report items in any position and, unlike tabular (or matrix) layout, does not restrict this position. In addition, rectangle and list report items can be used as free-form containers for other report items. A free-form layout is shown in Figure 2.1. Matrix Report LayoutMatrix layout (see Figure 2.2) is similar to a cross-tab or pivot table in Excel. Unlike table layout, which has a static number of columns and a dynamic number of rows, matrix layout has a dynamic number of rows and a dynamic number of columns . In other words, matrix layout propagates from top to bottom and from left to right. In turn , matrix layout allows grouping and summarizing by rows and columns. Developers can use aggregate functions for each group of rows and/or columns. Figure 2.2. Matrix report layout.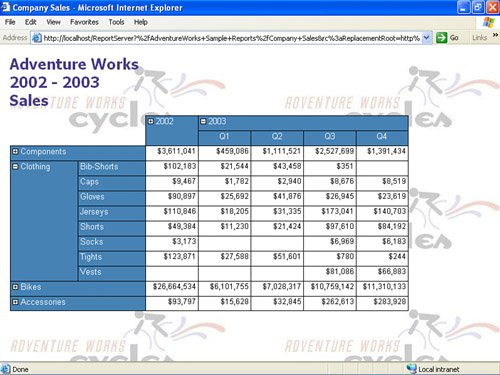 Matrix layout is accomplished using a Matrix data region and cannot be created by any other container. |
EAN: 2147483647
Pages: 254