Table Report Item
| Table presents data with static columns and expands row by row. Table allows you to group (a table can have multiple groups) and sort rows of data. See Chapter 12 for more details. Table has the best performance of all data regions . A cell in a table is a text box by default, but can be replaced with any other SSRS item, such as an image. A default table placed on a report contains three rows and three columns. You can interact with row, group, and column handles within the Report Designer interface to adjust table layout. If handles on the designer window are not visible, click on any cell within the table. Adjustment is very similar to that in Microsoft Excel and can be done by dragging adjustor lines or specifying Height and Width properties. See Figure 11.4 for design-time view of a table in Report Designer. Figure 11.4. Design-time view of a table.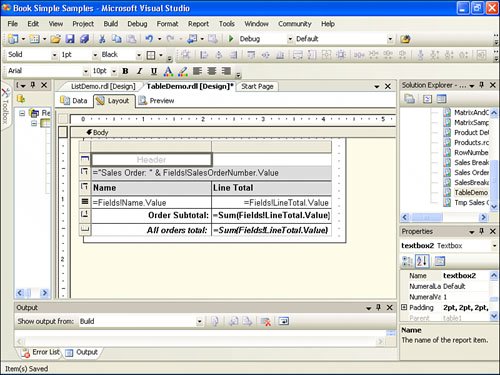 Each row on a table can be deleted or an additional row of the same type can be inserted. For example, a table can have multiple table detail, table header, table footer, group header, and group footer rows. To add an additional group header row, click on a row handle and select Insert Row Above or Insert Row Below from the drop-down menu. You can delete a row in a similar fashion. For example, Figure 11.4 demonstrates an empty space created by a retained table header row. To remove a row, right-click on the row handle and select Delete Rows from the shortcut menu. It is possible to first delete all rows of a certain type, such as table header. To reverse this operation, consult the following list, which shows a set of procedures for different types of rows:
To add data to a table in a simple scenario, you can drag and drop to a table's cell field from the Datasets window (which, in turn , drops a text box) or any report item to a cell. When the first field is dropped on a table, Report Designer sets the table's Dataset property to match the name of the data set from which the field came. As you can see in Figure 11.4, a row that displays subtotal information is the group footer. This book discusses more details of grouping in Chapter 12. In addition to subtotals, a table has header and footer rows for calculation of total numbers . A simple one-cell Table RDL is broken down into components in Table 11.3. Table 11.3. Table's RDL Explained
Tip When possible, use a table for best report performance. Multiple adjacent table cells can be merged horizontally into a single cell across multiple columns. Unlike Excel or Microsoft Word, SSRS table cells cannot be merged vertically even across the same type of rows, such as a detail row. Report Designer only preserves data from the first cell. Data in other merged cells is discarded. Report Designer allows you to split back to the original columns. To merge or split cells, select the cells, right-click the selection, and then select Merge Cells or Split Cells, respectively, from the shortcut menu (see Figure 11.5). Alternatively, Report Designer provides a toolbar button to perform this operation. The toolbar button icon is the same as the icon on the menu. Figure 11.5. Merging table cells.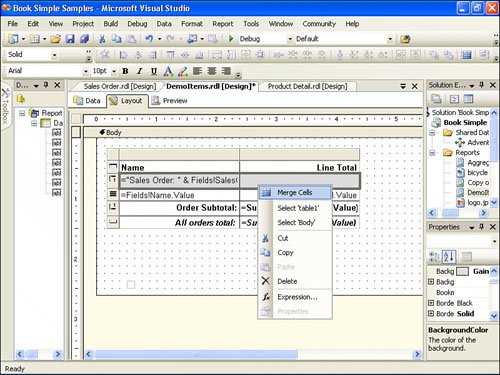 |
EAN: 2147483647
Pages: 254