The DataToGraph Code
| The added code for the DataToGraph application is contained in four methods. They are all shown in Listings 16.1 through 16.4. The Page_Load() MethodThe first is the Page_Load() method, and this is called each time the page is loaded. Listing 16.1 shows this code. Our code that's contained in the Page_Load() method is executed only if the IsPostBack property is not true. This will be the case the first time the page is requested, but not in response to a post back. This reduces the load on the server because the code needs to be executed only once. The first thing that happens in the Page_Load() method is the creation of a SqlConnection object. The connection string is stored in the Web.config file. This static method can pull configuration information from the Web.Config file, and in this case the connect string is in an element named ConnectString. In Listing 16.1, a SqlReader object is declared and initialized as null. This is done so that it will be obvious if an ExecuteReader() method has been called. If this method has been called, this object will not be null otherwise it will be null. A try/catch/finally construct is used to handle errors. If everything goes well, all of the code inside the try block will execute, followed by the execution of everything in the finally block. If, for some reason, an exception is thrown by the data access objects, then the catch block will be executed. In the catch block, the only thing that's done is to display the exception message in a user interface Label object named ErrorMessage.
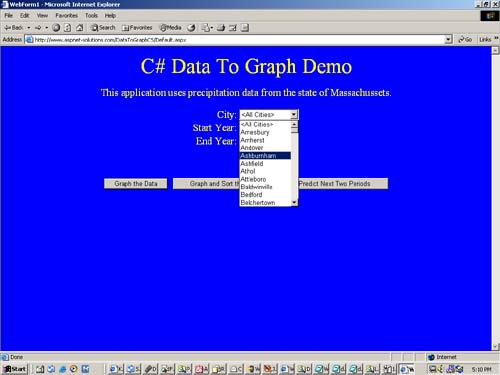
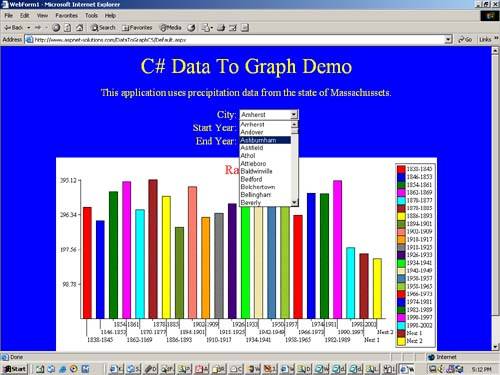
RECOMMENDED PRACTICE: A try/catch construct is understood to be the mechanism to catch and handle exceptions. But I'd like to point out that adding a finally clause to the construct is a good idea much of the time. Anytime that some cleanup must occur, whether or not an exception is thrown, a finally clause can act as the mechanism to ensure that the cleanup is performed. Inside of the try block, the SqlConnection object's Open() method is called. A SqlCommand object is then created with the SQL statement that will retrieve all of the cities in the database. Note that we're qualifying the cities with the DISTINCT keyword so that we just get a list of available cities. Each record in the database contains the city name, and if we didn't use the DISTINCT keyword, we'd get thousands of cities, most of which would be duplicates. The name of the user interface object that contains the city names is CityList, and it is a DropDownList object. To populate this list, we call the ExecuteReader() method, which returns a SqlDataReader object containing the names of the cities. The SqlDataSet object can be bound to the DropDownList object with the following two lines of code: C#CityList.DataSource = objReader; CityList.DataBind();VB CityList.DataSource = objReader CityList.DataBind() Although this code will bind data from the SqlDataReader to the DropDownList object, it won't bind the right data, as shown in Figure 16.2. Figure 16.2. Without Binding a Field, the DropDownList Object Will Contain the Record Type.
You need to specify which field will be bound as the display data, as follows, so that the correct data will appear, as shown in Figure 16.3: C#CityList.DataValueField = "City"; CityList.DataSource = objReader; CityList.DataBind();VB CityList.DataValueField = "City" CityList.DataSource = objReader CityList.DataBind() Figure 16.3. The DropDownList Contains the Correct Data.
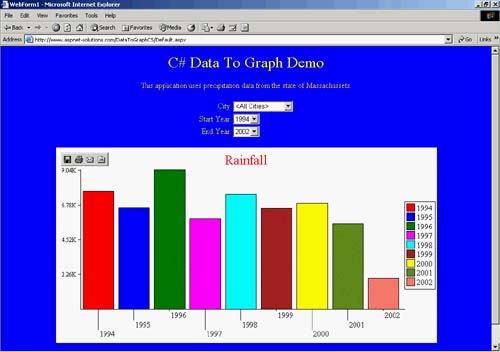
We need a way for the user to specify that the query is performed for all cities. To do this, an item is inserted at the top of the list containing the string "<All Cities>". This becomes the default choice because the first item in the list (at the index of zero) is the default choice. Before any other SQL commands are executed with this database connection, the SqlDataReader object must be closed. That's because a SqlConnection object can have at most one open data reader. As a matter of fact, with a data reader open, you won't even be able to call an Execute NonQuery() method without it throwing an exception. If you needed more open data readers, you'd need more open connections. The next thing that needs to be retrieved from the database is the list of years for which precipitation data exists. A DISTINCT keyword is added to the SQL so that the list contains only the unique years that are found. A SqlDataReader object is retrieved using the ExecuteReader() method. The StartYearList DropDownList object is set so that the YR (year) field populates the list. The DataSource property is set, followed by a call to the DataBind() method. Now the DropDownList is fully populated. A SqlDataReader contains a forward-only recordset. Once you have bound it to an object, it will not contain any data and cannot be used again. It would be easy enough to do another database query to get the data for the second DropDownList object, but this would place an unnecessary burden on the database. The most efficient way to populate the second DropDownList object is to loop through and populate it from the first DropDownList, as follows: for( int i=0; i<StartYearList.Items.Count; i++ ) { EndYearList.Items.Add( StartYearList.Items[i].Text ); } The finally clause cleans up the database objects. If the SqlDataReader object is not null, then it is closed. If the SqlConnection object is open, then it is closed. Listing 16.1 The Page_Load() Method private void Page_Load(object sender, System.EventArgs e) { if( !IsPostBack ) { SqlConnection objConnection = new SqlConnection(ConfigurationSettings.AppSettings["ConnectString"]); SqlDataReader objReader = null; try { objConnection.Open(); SqlCommand objCommand = new SqlCommand("SELECT DISTINCT City from PrecData order by City", objConnection ); objReader = objCommand.ExecuteReader(); CityList.DataValueField = "City"; CityList.DataSource = objReader; CityList.DataBind(); CityList.Items.Insert( 0, new ListItem( "<All Cities>", "" ) ); objReader.Close(); objCommand = new SqlCommand( "SELECT DISTINCT YR from PrecData order by YR", objConnection ); objReader = objCommand.ExecuteReader(); StartYearList.DataValueField = "YR"; StartYearList.DataSource = objReader; StartYearList.DataBind(); for( int i=0; i<StartYearList.Items.Count; i++ ) { EndYearList.Items.Add( StartYearList.Items[i].Text ); } EndYearList.SelectedIndex = EndYearList.Items.Count - 1; } catch( Exception ex ) { ErrorMessage.Text = ex.Message.ToString(); } finally { if( objReader != null ) { objReader.Close(); } if( objConnection.State == ConnectionState.Open ) { objConnection.Close(); } } } } The Graph_Click() MethodThe Graph_Click() method is fired when the user clicks the Graph button. It takes the data from the database, populates an instantiated Graph2D class, and then calls the Graph2D Render() method. You can see the results in Figure 16.4. Figure 16.4. The First Button Simply Graphs the Data According to the Selected City and the Data Range.
The method starts off by creating a SqlConnection string with the connection string retrieved from the Web.Config file. A try/catch/finally construct manages exceptions that are thrown by the database objects. If nothing goes wrong, the code in the try block is executed. If an exception is thrown by one of the database objects, the catch block will simply display the exception message in the user interface Label object named ErrorMessage. Whether or not an exception was thrown, though, the finally block closes the SqlConnection object if it is open. Inside the try block, the connection is opened. The SQL for this query finds the sum of all of the months for the span of years specified in the Start YearList and EndYearList objects. The total of all of the sums is in an expression named Value. If a city was selected, then an additional WHERE clause is added so that the city is a constraint for the query. Last, the query specifies that the recordset is grouped by YR (year) and ordered by the YR field. Because a SqlDataReader is a forward-only dataset, it will not suffice for the calculations that we're going to do. What we need is a DataSet that will contain the entire recordset, with which we can look at any record that we want. In other words, we can look at record 15, record 7, record 31, and then go back to record 15. To do this, we use a SqlDataAdapter object to perform the query and fill a DataSet object. The following code shows how to perform a simple query that fills a DataSet using a SqlDataAdapter object: C#SqlDataAdapter objDataAdapter = new SqlDataAdapter( "SELECT * from MyTable", objConnection ); DataSet objDataSet = new DataSet(); objDataAdapter.Fill( objDataSet, "MyTable" ); objConnection.Close();VB Dim objDataAdapter as _ new SqlDataAdapter( "SELECT * from MyTable", objConnection ) Dim objDataSet as new DataSet() objDataAdapter.Fill( objDataSet, "MyTable" ) objConnection.Close()
RECOMMENDED PRACTICE: It's better, whenever possible, to use a disconnected dataset so that the database isn't tied up with too many active connections. This can be done by simply closing the database connection once the dataset is filled. Everything is OK because the data is now in memory, and the code won't be going back to the tables. Once the DataSet is filled, the number of rows is retrieved and stored in an integer variable named nCount. Immediately after this, a Graph2D class named graph is instantiated. The one drawback to showing data in a bar graph is that the bars get pretty small if there are more than, say, 20 data values. If there are 20 data values or less, it's a simple matter of storing the data in the Graph2D object. If there are more than 20, though, some manipulation is necessary so that only 20 bars will be shown in the graph. The program deals with that situation this way: When there are more than 20 data values, it averages 2, 3, 4, or more data values into a single value. To find how many values are averaged into a single value, we simply take the number of data values and divide by 20. The following algorithm shows how it's done:
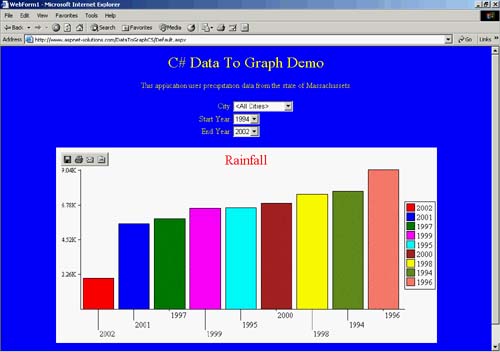
All we have to do now is create a loop that calculates the value for each bar of the graph. Then, we average the next 2, 3, 4, or however many data values. With the averaged value, we now store the data in the Graph2D object. Once all the data has been added, the Render() method is called. This renders the graph to a disk file. The rendering code is shown here, along with code to set the title to Rainfall: C#graph.Title = "Rainfall"; GraphImage.Text = "<IMG SRC=\"GraphImages/Graph" + graph.Render( Request.MapPath( "." ) ) + ".gif\">";VB graph.Title = "Rainfall" GraphImage.Text = "<IMG src="/books/2/627/1/html/2/ + Chr( 34 ) + "GraphImages/Graph" + graph.Render( Request.MapPath( "." ) ) + ".gif" + Chr( 34 ) + ">"; Listing 16.2 The Graph_Click() Method Performs a Simple Graphing Operation. private void Graph_Click(object sender, System.EventArgs e) { // Create a connection object. SqlConnection objConnection = new SqlConnection(ConfigurationSettings.AppSettings["ConnectString"]); try { // Open the connection. objConnection.Open(); // Create the SQL string. string strSql = "SELECT YR,(SELECT " + "Value=(Sum(Jan)+Sum(Feb)+Sum(Mar)+Sum(Apr)+Sum(May)+" + "Sum(Jun)+Sum(Jul)+Sum(Aug)+Sum(Sep)+Sum(Oct)+" + "Sum(Nov)+Sum(Dece))) from PrecData WHERE YR>=" + Convert.ToString( StartYearList.SelectedItem.Text ) + " and YR<=" + Convert.ToString( EndYearList.SelectedItem.Text ); // If the selection is valid, add it to the SQL. if( CityList.SelectedIndex > 0 ) { strSql += ( " and City='" + CityList.SelectedItem.Text + "'" ); } // Add the grouping and ordering. strSql += " group by YR order by YR"; // Create the SqlDataAdapter and DataSet, then // populate the dataset with the Fill() method. SqlDataAdapter objDataAdapter = new SqlDataAdapter( strSql, objConnection ); DataSet objDataSet = new DataSet(); objDataAdapter.Fill( objDataSet, "PrecData" ); objConnection.Close(); // Find out how many rows are in the dataset. int nCount = objDataSet.Tables[0].Rows.Count; Graph2D graph = new Graph2D(); // Here we don't have to adjust for too many entries. if( nCount <= 20 ) { for( int i=0; i<nCount; i++ ) { graph.AddPair( Convert.ToString( objDataSet.Tables[0].Rows[i].ItemArray[0] ), Convert.ToDouble(objDataSet.Tables[0].Rows[i].ItemArray[1] )); } } // Here we'll have to do some averaging because there are a lot // of entries. else { // Calculate the years per bar, number of bars, // and the count. int nYearsPerBar = nCount / 20; int nNumBars = nCount / nYearsPerBar; if( nCount % nYearsPerBar != 0 ) { nNumBars++; } // Loop through for each bar. for( int i=0; i<nNumBars; i++ ) { // For this iteration initialize the total, start, and end. double dTotal = 0; string strStart = ""; string strEnd = ""; // Loop through the years in this bar. for( int j=0; j<nYearsPerBar; j++ ) { // First year of the bar. if( j == 0 ) { strStart = Convert.ToString( objDataSet.Tables[0].Rows[i*nYearsPerBar+j].ItemArray[0]); } // Make sure we're in range. if( i * nYearsPerBar + j < nCount ) { // Create the end. strEnd = Convert.ToString( objDataSet.Tables[0].Rows[i*nYearsPerBar+j].ItemArray[0]); // Update the total. dTotal += Convert.ToDouble( objDataSet.Tables[0].Rows[i*nYearsPerBar].ItemArray[1] ); } } // Add the data. graph.AddPair( strStart + "-" + strEnd, dTotal ); } } // Set the graph title and the text for the image link. graph.Title = "Rainfall"; GraphImage.Text = "<IMG SRC=\"GraphImages/Graph" + graph.Render( Request.MapPath( "." ) ) + ".gif\">"; } catch( Exception ex ) { // Alert the user to the error. ErrorMessage.Text = ex.Message.ToString(); } finally { if( objConnection.State == ConnectionState.Open ) { objConnection.Close(); } } } The GraphAndSort_Click() MethodThe GraphAndSort_Click() method is fired when the user clicks the Graph And Sort button. It retrieves data based on the DropDownList selections, sorts the data, and then adds the data to an instantiated Graph2D object. Figure 16.5 shows a graph with sorted data. Figure 16.5. You Can Sort the Data with the Graph And Sort Button.
The code in Listing 16.3 that shows the GraphAndSort_Click() method starts off similarly to the code in Listing 16.2. The following list outlines the code that is similar to the code in the Graph_Click() method in Listing 16.2.
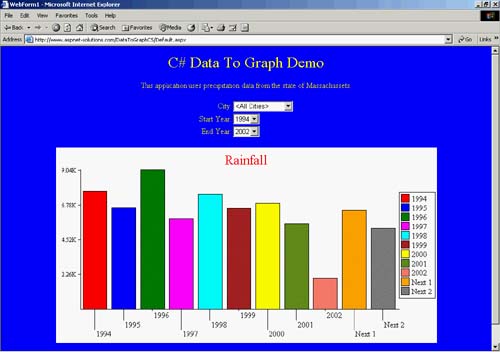
From this point, things change. Instead of populating the Graph2D object, the data is stored in an instantiated ArrayList object. This object has a Sort() method, and it will give us a quick and easy way to sort the data. ArrayList objects are able to sort native data types such a strings, but if we wanted it to support anything special, such as our own structure, we'd have to write a method with which the ArrayList object sorts the data. This is somewhat of a problem because our data consists of a string (the year(s)) and a double (the data value). At first glance, a structure is our best bet to contain the data, but that means we need to write a sorting code. To avoid having to write our own sorting code, we can convert the data into a string by concatenating the string and the double but we just have to convert the double to a string. We'll also have to put some sort of separator between the two pieces of data so that we can easily pull them apart later. Because none of the years will use the | character, that'll be the separator character. The formatting for the dValue variable below enables the value to have a consistent formatting regarding the decimal places. Here's how we'll create the single string from both pieces of data: objGraphData.Add( Convert.ToString( objDataSet.Tables[0].Rows[i].ItemArray[1] ) + "|" + dValue.ToString( "{000000.00000000}" ) ); As with the code in Listing 16.2, if there are 20 or fewer data values, we'll simply put them into the ArrayList object. But if there are more than 20 data values, we'll have to average several together to arrive at a bar graph with 20 or fewer bars. The following code calculates the number of years per bar (nYearsPerBar) and the number of bars (nBars) from the count (nCount). C# int nYearsPerBar = nCount / 20; int nNumBars = nCount / nYearsPerBar; if( nCount % nYearsPerBar != 0 ) { nNumBars++; } VBDim nYearsPerBar as Integer = nCount / 20 Dim nNumBars as Integer = nCount / nYearsPerBar If nCount MOD nYearsPerBar <> 0 Then nNumBars = nNumBars + 1 End If Now, to sort the data, all that we do is call the Sort() method on the ArrayList object (named objGraphData). It's then a simple matter of adding the data to the Graph2D object (named graph), calling the Render() method, and saving the file. Remember, though, that the string has to be split into a string and a double. The following code shows how this is done: C# for( int i=0; i<objGraphData.Count; i++ ) { string[] strData = ((string)objGraphData[i]).Split( new char[]{'|'},2); graph.AddPair( strData[1], Convert.ToDouble( strData[0] ) ); } graph.Title = "Rainfall"; GraphImage.Text = "<IMG SRC=\"GraphImages/Graph" + graph.Render( Request.MapPath( "." ) ) + ".gif\">"; VB Dim i as Integer For i=0 to objGraphData.Count - 1 String() strData = ((string)objGraphData(i)).Split( _ New char(){'|'},2) graph.AddPair( strData(1), Convert.ToDouble( strData(0) ) ); Next graph.Title = "Rainfall" GraphImage.Text = "<IMG SRC=\"GraphImages/Graph" + _ graph.Render( Request.MapPath( "." ) ) + _ ".gif\">" Listing 16.3 The GraphAndSort_Click() Method Sorts the Data Before Graphing. private void GraphAndSort_Click(object sender, System.EventArgs e) { SqlConnection objConnection = new SqlConnection(ConfigurationSettings.AppSettings["ConnectString"]); try { objConnection.Open(); string strSql = "SELECT YR,(SELECT " + "Value=(Sum(JAN)+Sum(Feb)+Sum(Mar)+Sum(Apr)+ " + "Sum(May)+Sum(Jun)+Sum(Jul)+Sum(Aug)+Sum(Sep)+" + "Sum(Oct)+Sum(Nov)+Sum(Dece))) from PrecData WHERE YR>=" + StartYearList.SelectedItem.Text + " and YR<=" + EndYearList.SelectedItem.Text; if( CityList.SelectedIndex > 0 ) { strSql += ( " and City='" + CityList.SelectedItem.Text + "'" ); } strSql += " group by YR order by YR"; SqlDataAdapter objDataAdapter = new SqlDataAdapter( strSql, objConnection ); DataSet objDataSet = new DataSet(); objDataAdapter.Fill( objDataSet, "PrecData" ); int nCount = objDataSet.Tables[0].Rows.Count; Graph2D graph = new Graph2D(); ArrayList objGraphData = new ArrayList(); if( nCount <= 20 ) { for( int i=0; i<nCount; i++ ) { double dValue = Convert.ToDouble( objDataSet.Tables[0].Rows[i].ItemArray[0] ); objGraphData.Add( Convert.ToString( objDataSet.Tables[0].Rows[i].ItemArray[1] ) + "|" + dValue.ToString( "{000000.00000000}" ) ); } } else { int nYearsPerBar = nCount / 20; int nNumBars = nCount / nYearsPerBar; if( nCount % nYearsPerBar != 0 ) { nNumBars++; } for( int i=0; i<nNumBars; i++ ) { double dTotal = 0; string strStart = ""; string strEnd = ""; for( int j=0; j<nYearsPerBar; j++ ) { if( j == 0 ) { strStart = Convert.ToString( objDataSet.Tables[0].Rows[i*nYearsPerBar+j].ItemArray[0]); } if( i * nYearsPerBar + j < nCount ) { strEnd = Convert.ToString( objDataSet.Tables[0].Rows[i*nYearsPerBar+j].ItemArray[0]); dTotal += Convert.ToDouble( objDataSet.Tables[0].Rows[i*nYearsPerBar].ItemArray[1] ); } } objGraphData.Add( dTotal.ToString( "000000.000000" ) + "|" + strStart + "-" + strEnd ); } } objGraphData.Sort(); for( int i=0; i<objGraphData.Count; i++ ) { string[] strData = ((string)objGraphData[i]).Split( new char[]{'|'},2); graph.AddPair( strData[1], Convert.ToDouble( strData[0] ) ); } graph.Title = "Rainfall"; GraphImage.Text = "<IMG SRC=\"GraphImages/Graph" + graph.Render( Request.MapPath( "." ) ) + ".gif\">"; } catch( Exception ex ) { ErrorMessage.Text = ex.Message.ToString(); } finally { if( objConnection.State == ConnectionState.Open ) { objConnection.Close(); } } } The Predict_Click() MethodThe Predict_Click() method is fired when the user clicks the Predict button. It retrieves data based on the DropDownList selections, sorts the data, and then adds the data to an instantiated Graph2D object. Figure 16.6 shows a graph with predicted data. Figure 16.6. A Prediction for Something Such as Rainfall Might Be Important.
The code in Listing 16.4 that shows the Predict_Click() method starts off similarly to the code in Listing 16.2. The following list outlines the code that is similar to the code in the Graph_Click() method in Listing 16.2:
Because we're going to add two calculated data values to the graph, we'll check to see whether there are 18 or fewer data values. If so, we'll simply add the 18 data values and then calculate the next 2 values. The next data values are harmonic means of the last data value and the average for all data values. The following code shows how to calculate the first derived data point: C#double dNext = ( ( dGrandTotal / (double) nCount ) + ( dLastTotal / (double) nLastCount ) ) / 2; graph.AddPair( "Next 1", dNext );VB Dim dNext as Double = ( ( dGrandTotal / (double) nCount ) + _ ( dLastTotal / nLastCount ) ) / 2 graph.AddPair( "Next 1", dNext ) As with the code in Listing 16.2, if there are more than 18 data values, we'll have to average several together to arrive at a bar graph with 18 or fewer bars. The code calculates the number of years per bar (nYearsPerBar) and the number of bars (nBars) from the count (nCount). Once all of the data has been added to the Graph2D object, the Render() method is called, and the bar graph is saved to disk. Listing 16.4 The Predict_Click() Method Predicts the Next Two Data Values. private void Predict_Click(object sender, System.EventArgs e) { SqlConnection objConnection = new SqlConnection(ConfigurationSettings.AppSettings["ConnectString"]); try { objConnection.Open(); string strSql = "SELECT YR,(SELECT " + "Value=(Sum(Jan)+Sum(Feb)+Sum(Mar)+Sum(Apr)+Sum(May)+" + "Sum(Jun)+Sum(Jul)+Sum(Aug)+Sum(Sep)+Sum(Oct)+" + "Sum(Nov)+Sum(Dece))) from PrecData WHERE YR>=" + Convert.ToString( StartYearList.SelectedItem.Text ) + " and YR<=" + Convert.ToString( EndYearList.SelectedItem.Text ); if( CityList.SelectedIndex > 0 ) { strSql += ( " and City='" + CityList.SelectedItem.Text + "'" ); } strSql += " group by YR order by YR"; SqlDataAdapter objDataAdapter = new SqlDataAdapter( strSql, objConnection ); DataSet objDataSet = new DataSet(); objDataAdapter.Fill( objDataSet, "PrecData" ); int nCount = objDataSet.Tables[0].Rows.Count; Graph2D graph = new Graph2D(); if( nCount <= 18 ) { double dGrandTotal = 0; double dLastTotal = 0; int nLastCount = 0; for( int i=0; i<nCount; i++ ) { dGrandTotal += Convert.ToDouble( objDataSet.Tables[0].Rows[i].ItemArray[1] ); if( i >= nCount - 4 ) { dLastTotal += Convert.ToDouble( objDataSet.Tables[0].Rows[i].ItemArray[1] ); nLastCount++; } graph.AddPair( Convert.ToString( objDataSet.Tables[0].Rows[i].ItemArray[0] ), Convert.ToDouble(objDataSet.Tables[0].Rows[i].ItemArray[1] )); } double dNext = ( ( dGrandTotal / (double) nCount ) + ( dLastTotal / (double) nLastCount ) ) / 2; graph.AddPair( "Next 1", dNext ); dGrandTotal += dNext; dLastTotal += dNext; dNext = ( ( dGrandTotal / (double) ( nCount + 1 ) ) + ( dLastTotal / (double) ( nLastCount + 1 ) ) ) / 2; graph.AddPair( "Next 2", dNext ); } else { double dGrandTotal = 0; double dLastTotal = 0; int nLastCount = 0; int nYearsPerBar = nCount / 20; int nNumBars = nCount / nYearsPerBar; if( nCount % nYearsPerBar != 0 ) { nNumBars++; } for( int i=0; i<nNumBars; i++ ) { double dTotal = 0; string strStart = ""; string strEnd = ""; for( int j=0; j<nYearsPerBar; j++ ) { if( j == 0 ) { strStart = Convert.ToString( objDataSet.Tables[0].Rows[i*nYearsPerBar+j].ItemArray[0] ); } if( i * nYearsPerBar + j < nCount ) { strEnd = Convert.ToString( objDataSet.Tables[0].Rows[i*nYearsPerBar+j].ItemArray[0] ); dTotal += Convert.ToDouble( objDataSet.Tables[0].Rows[i*nYearsPerBar].ItemArray[1] ); } } dGrandTotal += dTotal; if( i >= nNumBars - 4 ) { dLastTotal += dTotal; nLastCount++; } graph.AddPair( strStart + "-" + strEnd, dTotal ); } double dNext = ( ( dGrandTotal / (double) nCount ) + ( dLastTotal / (double) nLastCount ) ) / 2; graph.AddPair( "Next 1", dNext ); dGrandTotal += dNext; dLastTotal += dNext; dNext = ( ( dGrandTotal / (double) ( nCount + 1 ) ) + ( dLastTotal / (double) ( nLastCount + 1 ) ) ) / 2; graph.AddPair( "Next 2", dNext ); } graph.Title = "Rainfall"; GraphImage.Text = "<IMG SRC=\"GraphImages/Graph" + graph.Render( Request.MapPath( "." ) ) + ".gif\">"; } catch( Exception ex ) { ErrorMessage.Text = ex.Message.ToString(); } finally { if( objConnection.State == ConnectionState.Open ) { objConnection.Close(); } } } |
EAN: N/A
Pages: 175