Component and Deployment Diagrams
Component and Deployment Diagrams
The last diagram discussed in this chapter is the component diagram. Component diagrams give a high-level, abstract view of your software. For the BandSpy component diagram, the majority of the code is reduced to a single component on the Web server. Technically elements such as the Web server are parts of another UML diagram called deployment diagrams. Deployment diagrams show some of the physical elements of your applications' infrastructure, such as the different servers your application runs on.
In Figure 2-14, the large cube-shaped boxes are called nodes. Think of a node as a separate piece of physical hardware, or, in a more conceptual sense, as a defined, separate system of software such as a Web browser.
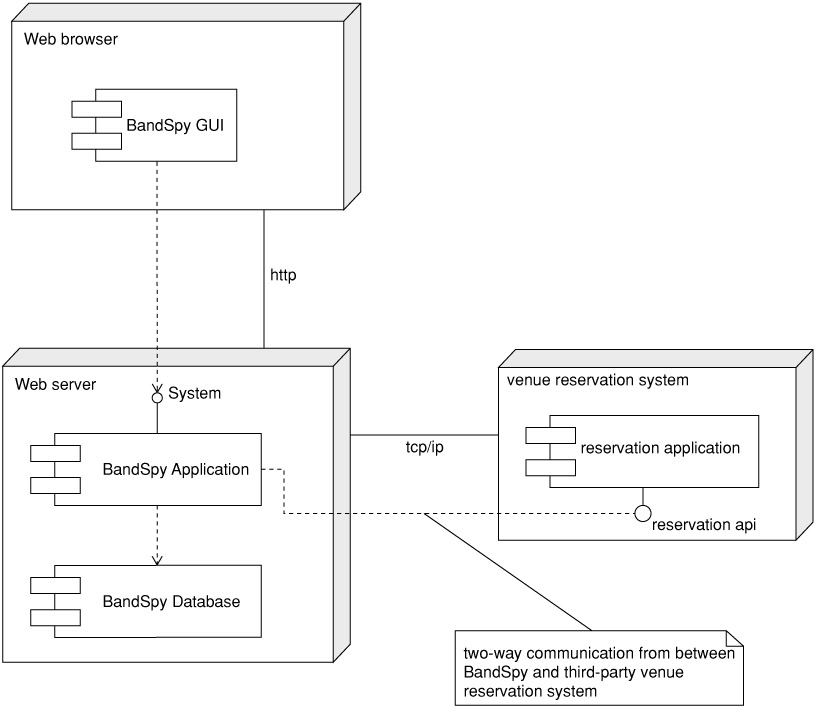
Figure 2-14
The components are the smaller rectangles within the nodes. Dashed arrows are dependencies. The BandSpy Web GUI is dependent upon the BandSpy application on the Web server. The reverse is not true; however, another client could access the system. Solid lines show a connection between nodes for example, the Web browser communicating over HTTP.
The small circles are a kind of shorthand to show an interface. As mentioned earlier, our application has a single System interface that all clients have to use. Another interface is shown within the venue reservation system node. The company that manages the system has provided you with a list of the public methods you can use. You don't need to know any of the inner workings of the venue system; you just need to know the methods of the Application Programming Interface (API) used in the reservation system.