Handling Errors in Reports
As you create more complex reports and use more intricate expressions in those reports, you increase the chance of introducing errors. Visual Studio lets you know you have an error when you try to preview a report. You will receive a message in the Preview tab saying, “There are compilation errors. See Task List for details.”
Fortunately, Visual Studio also provides tools for dealing with errors. A list of detailed error messages is displayed in both the Build section of the Output Window and in the Task List Window. In most cases, these error messages provide a pretty good description of the problem. In many cases, the problem is a syntax error in an expression you constructed in a property of a report item.
If you double-click an error entry in the Task List Window, you return to the Layout tab (if you are not already there) and the report item that contains the offending expression is selected. You can then use the error message to determine which property contains the error and fix the problem. In some cases, if you open the Properties dialog box for the report item, the property containing the error has an exclamation mark surrounded by a red circle placed next to it.
Once you have made changes to remedy each error listed in the Task List Window, you can click the Preview tab to run the report. If all of the errors have been corrected, the Build section of the Output Window shows “0 errors” and all of the entries are cleared out of the Task List Window. If you still have errors, continue the debugging process by double-clicking on a Task List Window entry and try again to correct the error.
The Employee Time Report
Features Highlighted
-
Using a report template
-
Putting totals in headers and footers
-
Using the scope parameter in an aggregate function
-
Toggling visibility
Business Need The Galactic Delivery Services personnel department needs a report showing the amount of time entered by its employees on their weekly timesheets. The report should group the time by job, employee, and week, with totals presented for each grouping. The groups should be collapsed initially, and the user should be able to drill down into the desired group. Group totals should be visible even when the group is collapsed.
Task Overview
-
Create the Chapter07 Project, a Shared Data Source, a New Report, and a Dataset
-
Populate the Report Layout
-
Add Drilldown Capability
-
Add Totaling
Employee Time Report, Task 1: Create the Chapter07 Project, a Shared Data Source, a New Report, and a Dataset
-
Create a new Reporting Services project called Chapter07 in the MSSQLRS folder. (If you need help with this task, see the section “The Transport List Report” in Chapter 5.)
-
Create a shared data source called Galactic for the Galactic database. (Again, if you need help with this task, see the section “The Transport List Report” in Chapter 5.)
-
Right-click Reports in the Solution Explorer. Select Add | Add New Item from the context menu. The Add New Item dialog box will appear.
-
Single-click GDSReport in the Templates area to select it. Change the Name to EmployeeTime and click Open.
-
Select <New Dateset…> from the Dataset drop-down list. The Dataset dialog box will appear.
-
Enter EmployeeTime for the name in the Dataset dialog box.
-
Galactic will be selected for the data source by default. Click OK. You will return to the Data tab, which now displays the Generic Query Designer.
-
Type the following in the SQL pane:
SELECT Description AS Job, Employee.EmployeeNumber, FirstName, LastName, CONVERT(char(4),DATEPART(yy, WorkDate))+'-'+ CONVERT(char(2),DATEPART(wk, WorkDate)) AS Week, WorkDate, HoursWorked FROM TimeEntry INNER JOIN Assignment ON TimeEntry.AssignmentID = Assignment.AssignmentID INNER JOIN Employee ON Assignment.EmployeeNumber = Employee.EmployeeNumber INNER JOIN Job ON Assignment.JobID = Job.JobID ORDER BY Job, Employee.EmployeeNumber, Week, WorkDate
-
Run the query to make sure there are no errors.
-
Select the Layout tab.
Task Notes If you need to, refer back to the database diagram for the personnel department in Chapter 3 to see how the TimeEntry, Assignment, Employee, and Job tables are related. Our query joins these four tables together to determine what work hours were entered for each employee and what job they held.
We are using a combination of the CONVERT() and DATEPART() functions to create a string containing the year and the week number for each time entry. This allows us to group the time into work weeks. Note that the year comes first in this string so that it will sort correctly across years.
When you selected the Layout tab, there was already content in the page header and page footer of the report. This, of course, is due to the fact that we used our new GDSReport template to create the report. By using our report template, we will have a consistent header and footer on our reports without having to work at it.
Employee Time Report, Task 2: Populate the Report Layout
-
Place a text box onto the body of the report. Modify the following properties of this text box:
Property
Value
Font: FontSize
25pt
Font: FontWeight
Bold
Location: Left
0in
Location: Top
0in
Size: Width
2.875in
Size: Height
0.5in
Value
Employee Time
-
Place a table onto the body of the report immediately below the text box you just added.
-
Drag the WorkDate field into the detail row in the center column of the table.
-
Drag the HoursWorked field into the detail row in the right-hand column of the table.
-
Select the entire header row in the table. Modify the following property:
Property
Value
TextDecoration
Underline
-
Right-click in the gray square to the upper-left of the table. Select Properties from the context menu. The Table Properties dialog box will appear. Select the Groups tab.
-
Click Add. The Grouping and Sorting Properties dialog box will appear.
-
Type JobGroup for the name. (No spaces are allowed in group names.)
-
In the Expression area, select “=Fields!Job.Value” from the drop-down list.
-
Click OK to exit the Grouping and Sorting Properties dialog box.
-
Click Add again. The Grouping and Sorting Properties dialog box will appear.
-
Type EmpNumGroup for the name.
-
In the Expression area, select “=Fields!EmployeeNumber.Value” from the drop-down list.
-
Click OK to exit the Grouping and Sorting Properties dialog box.
-
Click Add a third time. The Grouping and Sorting Properties dialog box will appear.
-
Type WeekGroup for the name.
-
In the Expression area, select “=Fields!Week.Value” from the drop-down list.
-
Click OK to exit the Grouping and Sorting Properties dialog box.
-
Click OK to exit the Table Properties dialog box.
-
Click in any cell in the table. Notice how three group header rows and three group footer rows have been added to the table. The gray boxes to the left of the table identify the group rows as 1, 2, and 3. Drag the Job field into the leftmost cell in the group 1 header row.
-
Right-click the gray rectangle above the leftmost column in the table. Select Insert Column to the Right from the context menu.
-
Drag the EmployeeNumber field into the cell in the column you just created and in the Group 2 header row.
-
Drag the width of the leftmost column in the table until the column is just wide enough for the word “Job” in the table header cell.
-
Select the two leftmost cells in the row for the Group 1 header, right-click them, and select Merge Cells from the context menu. (Click and drag or hold down SHIFT while clicking to select multiple cells at the same time.)
-
Right-click the gray rectangle above the second-from-the-left column in the table. Select Insert Column to the Right from the context menu.
-
Drag the Week field into the cell in the column you just created in the Group 3 header row.
-
Drag the width of the second column from the left until it is just wide enough for the words “Employee Number” in the table header cell.
-
Drag the width of the third column from the left until it is just wide enough for the “=Fields!Week.Value” expression in the Group 3 header cell.
-
Select the three group header rows at the same time. Modify the following property in the Property window:
Property
Value
Font: FontWeight
Bold
-
Select the three cells in the center of the Group 2 header row, right-click them, and select Merge Cells from the context menu.
-
Modify the following properties for the merged cell that results from step 30:
Property
Value
TextAlign
Left
Value (Select <Expression…> from the drop-down list to make editing easier. You can select the field expressions from the Fields area and use Append to add them to the Expression area. Remember, the Globals, Parameters, and Fields expressions are case sensitive!)
=Fields!EmployeeNumber.Value & “-” & Fields!FirstName.Value & “ ” & Fields!LastName.Value
-
Your report layout should appear similar to Figure 7-5.
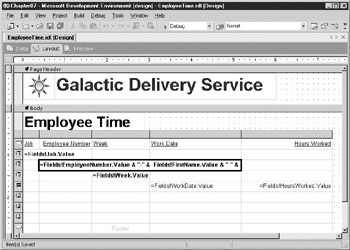
Figure 7-5: Employee Time Report layout after Task 2 -
Select the Preview tab. Your report should appear similar to Figure 7-6.
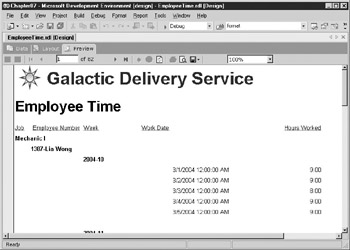
Figure 7-6: Employee Time Report preview after Task 2
Task Notes We have placed a table on our report to contain the employee time information. We have created three groups within the table to contain the groups required by the business needs for this report. The detail information is grouped into weeks (WeekGroup). The week groups are grouped into employees (EmpNumGroup). The employee groups are grouped into jobs (JobGroup). By merging cells in the grouping rows, we are able to give the report a stepped look yet keep the width of our steps small so there is enough room for the detail information.
Employee Time Report, Task 3: Add Drilldown Capability
-
Select the Layout tab.
-
Select the entire table and bring up the Table Properties dialog box as we did in step 6 of Task 2. Select the Groups tab.
-
Select EmpNumGroup and click Edit. The Grouping and Sorting Properties dialog box will appear.
-
Select the Visibility tab.
-
Select Hidden for the Initial Visibility setting.
-
Check the box labeled Visibility Can Be Toggled By Another Report Item.
-
Select Job from the Report Item drop-down list.
-
Click OK to exit the Grouping and Sorting Properties dialog box.
-
Select WeekGroup and click Edit. The Grouping and Sorting Properties dialog box will appear.
-
Select the Visibility tab.
-
Select Hidden for the Initial Visibility setting.
-
Check the box labeled Visibility Can Be Toggled By Another Report Item.
-
Select EmployeeNumber from the Report Item drop-down list.
-
Click OK to exit the Grouping and Sorting Properties dialog box.
-
Click Details Grouping. The Details Grouping dialog box will appear.
-
Select the Visibility tab.
-
Select Hidden for the Initial Visibility setting.
-
Check the box labeled Visibility Can Be Toggled By Another Report Item.
-
Select Week from the Report Item drop-down list. (It is at the bottom of the list.)
-
Click OK to exit the Details Grouping dialog box.
-
Click OK to exit the Table Properties dialog box.
-
Select the Preview tab. Your report should appear similar to Figure 7-7 after expanding the top few groups.
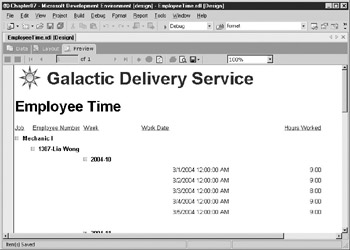
Figure 7-7: Employee Time Report preview after Task 3
Task Notes We now have the drilldown capability working as required for this report. This was done by using the visibility and toggling properties of the groupings in the table. The visibility of each group is set to be toggled by a report item that is in the group above it. Therefore, EmpNumGroup is set to be toggled by the Job report item in JobGroup, and WeekGroup is set to be toggled by the EmployeeNumber report item in EmpNumGroup.
For the purposes of visibility, the detail row of the table is treated as a group. It is called the details grouping. The details grouping is set to be toggled by the Week report item, which is part of WeekGroup.
EmpNumGroup, WeekGroup, and the details grouping all have their initial visibility set to Hidden. This means that when you run the report in the Preview tab, you do not see any of these groups. Only the top group, JobGroup, is visible.
Remember that in data regions, the items are repeated according to the rows in the dataset. Therefore, the report contains a number of JobGroup rows, one for each distinct job contained in the dataset. Each JobGroup contains sets of EmpNumGroup rows, WeekGroup rows, and the details grouping rows.
The first JobGroup contains a Job report item (text box) with a value of “Mechanic I”. There is a small plus sign in front of “Mechanic I” because it controls the visibility of the EmpNumGroup rows in the “Mechanic I” JobGroup. Clicking the plus sign changes the visibility of all the EmpNumGroup rows in the “Mechanic I” JobGroup from hidden to visible. The EmpNumGroup rows in the “Mechanic I” JobGroup now show up on the report.
When the EmpNumGroup rows are visible in the “Mechanic I” JobGroup, the plus sign next to “Mechanic I” changes to a minus sign. Clicking the minus sign will again change the visibility of all the EmpNumGroup rows in the “Mechanic I” JobGroup, this time from visible to hidden. The EmpNumGroup rows in the “Mechanic I” JobGroup now disappear from the report.
Click the plus and minus signs to change the visibility of various groups and detail rows in the report. Make sure you have a good understanding of how visibility and toggling are working in the report. We will make it a bit more complicated in Task 4.
Employee Time Report, Task 4: Add Totaling
-
Select the Layout tab.
-
Right-click the rightmost cell in the Group 1 header row and select Properties from the context menu. The Textbox Properties dialog box will appear.
-
Type the following for Value:
=Sum(Fields!HoursWorked.Value)
Note To save some typing, you can select “=Fields!HoursWorked.Value” from the Value drop-down list and then add in the additional text.
-
Click Advanced. The Advanced Textbox Properties dialog box will replace the Textbox Properties dialog box.
-
Select the Visibility tab.
-
Check the box labeled Visibility Can Be Toggled By Another Report Item.
-
Select Job from the Report Item drop-down list. (We are leaving Initial Visibility set to Visible.)
-
Click OK to exit the Advanced Textbox Properties dialog box.
-
Right-click the rightmost cell in the Group 2 header row and select Properties from the context menu. The Textbox Properties dialog box will appear.
-
Type the following for Value:
=Sum(Fields!HoursWorked.Value)
-
Click Advanced. The Advanced Textbox Properties dialog box will replace the Textbox Properties dialog box.
-
Select the Visibility tab.
-
Check the box labeled Visibility Can Be Toggled By Another Report Item.
-
Select EmployeeNumber from the Report Item drop-down list. (We are leaving Initial Visibility set to Visible.)
-
Click OK to exit the Advanced Textbox Properties dialog box.
-
Right-click the rightmost cell in the Group 3 header row and select Properties from the context menu. The Textbox Properties dialog box will appear.
-
Type the following for Value:
=Sum(Fields!HoursWorked.Value)
-
Click Advanced. The Advanced Textbox Properties dialog box will replace the Textbox Properties dialog box.
-
Select the Visibility tab.
-
Check the box labeled Visibility Can Be Toggled By Another Report Item.
-
Select Week from the Report Item drop-down list. (We are leaving Initial Visibility set to Visible.)
-
Click OK to exit the Advanced Textbox Properties dialog box.
-
Click the gray square for the Group 1 footer row. Modify the following properties for this footer row using the Properties window (the drop-down list at the top of the Properties window will call this TableRow8):
Property
Value
Visibility: Hidden
True
Visibility: ToggleItem
Job
-
Click the gray square for the Group 2 footer row. Modify the following properties for this footer row using the Properties window:
Property
Value
Visibility: Hidden
True
Visibility: ToggleItem
EmployeeNumber
-
Click the gray square for the Group 3 footer row. Modify the following properties for this footer row using the Properties window:
Property
Value
Visibility: Hidden
True
Visibility: ToggleItem
Week
-
Select the rightmost cell in the Group 3 footer row. Modify the following properties for this text box using the Properties window:
Property
Value
BorderStyle: Top
Solid
Font: FontWeight
Bold
Value (Select <Expression…> from the drop-down list to make it easier to enter this value.)
=Sum(Fields!HoursWorked.Value)
Note You can accomplish steps 27 and 28 by copying the text box whose properties you modified in step 26 and pasting it into the cells specified in steps 27 and 28. Make sure that you have the text box selected without the flashing text edit cursor inside of it, before you try to copy it.
-
Repeat step 26 for the rightmost cell in the Group 2 footer row.
-
Repeat step 26 for the rightmost cell in the Group 1 footer row.
-
Select the rightmost cell in the table footer row. Modify the following properties for this text box using the Properties window:
Property
Value
BorderStyle: Top
Double
BorderWidth: Top
3pt
Font: FontWeight
Bold
Value (Select <Expression…> from the drop-down list to make it easier to enter this value.)
=Sum(Fields!HoursWorked.Value)
-
Your report layout should appear similar to Figure 7-8.
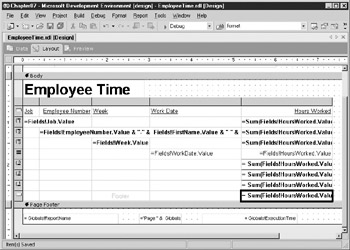
Figure 7-8: The Employee Time Report layout after Task 4 -
Select the Preview tab. Your report should appear similar to Figure 7-9 when the top few groups are expanded.
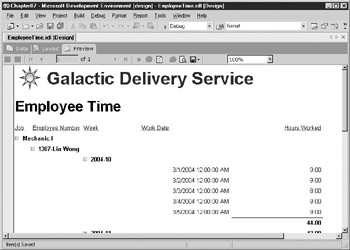
Figure 7-9: The Employee Time Report preview after Task 4 -
Click Save All in the toolbar.
Task Notes Now we not only have a report with group totals, we have a report that keeps its group totals where they ought to be. When the group is collapsed, the group total is on the same line with the group header. When the group is expanded, the group total moves from the group header to the group footer.
When you think about it, this is how you would expect things to work. When the group is collapsed, we expect it to collapse down to one line. Therefore, the group total should be on the line with the group header. When the group is expanded, there is a column of numbers in the group. We would naturally expect the total for that column of numbers to be below it. Therefore, the group total should move to the group footer.
We achieved this functionality by using our toggle items to control the visibility of three other items at the same time. In the previous section, we discussed the fact that “Mechanic I” controls the visibility of the EmpNumGroup rows in the “Mechanic I” JobGroup. Now, “Mechanic I” also controls the visibility of the Hours Worked total in the group header and the Hours Worked total in the group footer. The Hours Worked total in the group header is initially set to Visible. The Hours Worked total in the group footer is initially set to Hidden.
When the plus sign next to “Mechanic I” is clicked, three things occur:
-
The EmpNumGroup rows are set to Visible.
-
The Hours Worked total in the group header is set to Hidden.
-
The Hours Worked total in the group footer is set to Visible.
When the minus sign next to “Mechanic I” is clicked, the reverse takes place. This same behavior occurs at each level. Again, you can click the plus and minus signs to change the visibility of various groups and detail rows in the report. Make sure you understand how the visibility and toggle items interrelate.
The other feature of note used in this task is the Sum() aggregate function. If you were paying attention, you will have noticed that we used the following expression in a number of different locations:
= Sum(Fields!HoursWorked.Value)
If you were paying close attention, you would have also noticed that this expression yields a number of different results. How does this happen? It happens through the magic of scope.
Scope is the data grouping in which the aggregate function has been placed. For example, the Sum() function placed in the JobGroup header row (the Group 1 header row) uses the current JobGroup as its scope. It sums hours worked only for those records in the current JobGroup data grouping. The Sum() function placed in the EmpNumGroup header row (the Group 2 header row) uses the current EmpNumGroup as its scope. It sums the hours worked only for those records in the current EmpNumGroup data grouping. The Sum() function placed in the table footer row is not within any data grouping, so it sums the hours worked in the entire dataset.
As you have seen in this report, it does not make a difference whether the aggregate function is placed in the group header or the group footer. Either way, the aggregate function acts on all the values in the current data grouping. At first, this may seem a bit counterintuitive. It is easy to think of the report being processed sequentially from the top of the page to the bottom. In this scenario, the total for a group would only be available in the group footer after the contents of that group had been processed. Fortunately, this is not the way Reporting Services works. The calculation of aggregates is separate from the rendering of the report. Therefore, aggregates can be placed anywhere in the report.
Finally, it is very important not to confuse the aggregate functions within Reporting Services with the aggregate functions that exist within the environs of SQL Server. Many of the Reporting Services aggregate functions have the same names as SQL Server aggregate functions. Despite this fact, Reporting Services aggregate functions and SQL Server aggregate functions work in different locations.
SQL Server aggregate functions work within a SQL Server query. They are executed by SQL Server as the dataset is being created by the database server. SQL Server aggregate functions do not have a concept of scope. They simply act on all the data that satisfies the WHERE clause of the query. As we just discussed, Reporting Services aggregate functions are executed, after the dataset is created, as the report is executing and are very dependent on scope.
The Employee List Report
Features Highlighted
-
Implementing user-selectable grouping
-
Implementing user-selectable sorting
-
Using explicit page breaks
Business Need The Galactic Delivery Services personnel department would like a flexible report for listing employee information. Rather than having a number of reports for each of their separate grouping and sorting needs, they would like a single report where they can choose the grouping and sort order each time the report is run. The report should be able to group on job, hub, or city of residence. The report should be able to sort by employee number, last name, or hire date. Also, each new group should start on a new page.
Task Overview
-
Create a New Report and a Dataset
-
Create the Report Layout
Employee List Report, Task 1: Create a New Report and a Dataset
-
Reopen the Chapter07 project if it has been closed. Close the Employee Time Report if it is still open.
-
Right-click Reports in the Solution Explorer and select Add | Add New Item from the context menu. The Add New Item dialog box will appear.
-
Single-click GDSReport in the Templates area to select it. Change the name to EmployeeList and click Open.
-
Choose <New Dataset…> from the Dataset drop-down list. The Dataset dialog box will appear.
-
Enter Employees for the name in the Dataset dialog box.
-
Galactic will be selected for the data source by default. Click OK. You will return to the Generic Query Designer in the Data tab.
-
Type the following in the SQL pane:
SELECT Job.Description AS Job, Hub.Description AS Hub, Employee.EmployeeNumber, FirstName, LastName, Address1, City, State, ZipCode, HireDate, HighestLevelOfEducation, UnionMembership FROM Employee INNER JOIN Assignment ON Employee.EmployeeNumber = Assignment.EmployeeNumber INNER JOIN Job ON Assignment.JobID = Job.JobID INNER JOIN Hub ON Assignment.HubCode = Hub.HubCode
-
Run the query to make sure it is correct.
Task Notes You will notice that there is no ORDER BY clause in our SELECT statement. In most cases, this would cause a problem. Users like to have their information show up in something other than a random sort order. In this case it is fine, because we will be sorting the data within the report itself according to what the user selects as report parameters.
Employee List Report, Task 2: Create the Report Layout
-
Select the Layout tab.
-
Place a text box onto the body of the report. Modify the following properties of this text box:
Property
Value
Font: FontSize
25pt
Font: FontWeight
Bold
Location: Left
0in
Location: Top
0in
Size: Width
2.875in
Size: Height
0.5in
Value
Employee List
-
Place a table onto the body of the report immediately below the text box you just added.
-
Drag the EmployeeNumber field into the leftmost cell in the detail row of the table.
-
Drag the FirstName field into the middle cell in the detail row of the table.
-
Drag the LastName field into the rightmost cell in the detail row of the table.
-
Right-click the gray rectangle above the rightmost column in the table and select Insert Column to the Right from the context menu.
-
Drag the Address1 field into the detail row of the newly created column.
-
Repeat steps 7 and 8 for the City, State, ZipCode, HireDate, HighestLevelOfEducation, and UnionMembership fields.
-
Select the cell in the detail row containing the HireDate expression. Modify the following property:
Property
Value
Format
MM/dd/yyyy
Note The value for the Format property is case sensitive.
-
Size each column appropriately. Use the Preview tab to check your work. Continue switching between the Layout tab and the Preview tab until you have the table columns sized appropriately.
-
Drag the right edge of the report body layout area until it is just touching the right side of the table.
-
Click the gray square for the table header row. Modify the following property:
Property
Value
TextDecoration
Underline
-
Click in the report layout area. From the main menu, select Report | Report Parameters. The Report Parameters dialog box will appear.
-
Click Add.
-
Type GroupOrder for Name and Group By for Prompt.
-
Uncheck the Allow Blank Value option.
-
Fill in the Available Values table as follows:
Label
Value
Job
Job
Hub
Hub
City
City
-
Select Non-queried for Default Values.
-
Type Job in the text box for Default Values.
-
Click Add to add a second report parameter.
-
Type SortOrder for Name and Sort By for Prompt.
-
Uncheck the Allow Blank Value option.
-
Fill in the Available Values table as follows:
Label
Value
Emp Num
Emp Num
Last Name
Last Name
Hire Date
Hire Date
-
Select Non-queried for Default Values.
-
Type Emp Num in the text box for Default Values.
-
Click OK to exit the Report Parameters dialog box.
-
Select the entire table and bring up the Table Properties dialog box.
-
Check the box labeled Repeat Header Rows on Each Page.
-
Select the Groups tab.
-
Click Add. The Grouping and Sorting Properties dialog box will appear.
-
Select <Expression…> from the Expression drop-down list. The Edit Expression dialog box will appear.
-
Type the following in the Expression area:
= IIF( Parameters!GroupOrder.Value = "Job", Fields!Job.Value, IIF(Parameters!GroupOrder.Value = "Hub", Fields!Hub.Value, Fields!City.Value))
Note Use the Parameters and Fields entries on the left side of the Edit Expression dialog box to help build expressions such as the one above. Click on the desired parameter or field to highlight it, then click the Append button to add it to the end of the expression you are building.
-
Highlight the entire expression you just entered and press CTRL-C to copy this text.
-
Click OK to exit the Edit Expression dialog box.
-
Check the box labeled Page Break at End.
-
Uncheck the box labeled Include Group Footer.
-
Select the Sorting tab.
-
Select <Expression…> from the Expression drop-down list. The Edit Expression dialog box will appear.
-
Delete the equals sign from the Expression area and press CTRL-V to paste the expression into the Expression area. This should be the same expression you entered in step 33.
-
Click OK to exit the Edit Expression dialog box.
-
Leave the sort direction as Ascending. Click OK to exit the Grouping and Sorting Properties dialog box.
-
Select the Sorting tab.
-
Select <Expression…> from the Expression drop-down list. The Edit Expression dialog box will appear.
-
Type the following in the Expression area:
= IIF( Parameters!SortOrder.Value = "Emp Num", Fields!EmployeeNumber.Value, IIF(Parameters!SortOrder.Value = "Last Name", Fields!LastName.Value, Fields!HireDate.Value))
-
Click OK to exit the Edit Expression dialog box.
-
Leave the sort direction as Ascending. Click OK to exit the Table Properties dialog box.
-
Select the three leftmost cells in the Group 1 header row. Right-click these cells and select Merge Cells from the context menu.
-
Right-click these cells again and select Expression from the context menu.
-
Delete the equals sign from the Expression area and press CTRL-V to paste the expression into the Expression area. This should be the same expression you entered in step 33.
-
Click OK to exit the Edit Expression dialog box.
-
Modify the following property of the merged cells:
Property
Value
Font: Weight
Bold
-
Your report layout should appear similar to Figure 7-10.
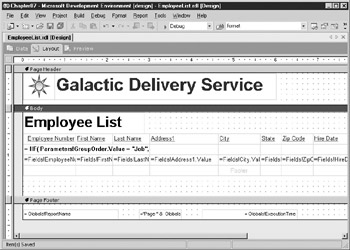
Figure 7-10: The Employee List Report layout -
Select the Preview tab. Select a grouping and a sort order, then click View Report. Your report should appear similar to Figure 7-11. Experiment with changing the grouping and sort order. Remember to click View Report each time you want the report to refresh.
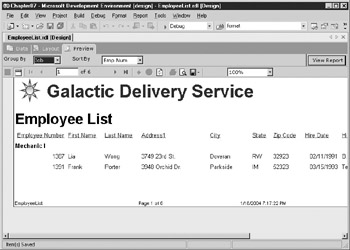
Figure 7-11: The Employee List Report preview -
Click Save All in the toolbar.
Task Notes: In this report, the report parameters are used to control properties within the report rather than as parameters to a SQL query. Because of this, we needed to create these report parameters manually rather than having them created automatically from the dataset query. We also manually constructed lists of valid values and provided a default value for each one. We were then able to use the values selected for those parameters to change the grouping and sorting of the table in the report.
We are able to change the grouping and sorting of the table because of the IIF() function. This function has three parameters. The first parameter is a Boolean expression (in other words, an expression that results in either a true or false value). The second parameter is the value that is returned if the Boolean expression is true. The third parameter is the value that is returned if the Boolean expression is false.
Let’s take a look at one of our expressions using the IIF() function:
= IIF( Parameters!GroupOrder.Value = "Job", Fields!Job.Value, IIF(Parameters!GroupOrder.Value = "Hub", Fields!Hub.Value, Fields!City.Value))
This expression actually uses two IIF() functions, one nested inside the other. The first parameter of the outer IIF() function is
Parameters!GroupOrder.Value = "Job"
If “Job” is selected for the grouping, the value of the second parameter is returned by the function. In this case, the second parameter is
Fields!Job.Value
Therefore, if “Job” is selected for the grouping, the value of the Job field is used.
If “Job” is not selected for the grouping, the value of the third parameter is returned. The value of this third parameter is another complete IIF() function:
IIF(Parameters!GroupOrder.Value = "Hub", Fields!Hub.Value, Fields!City.Value)
In this second IIF() function, if “Hub” is selected for the grouping, the second parameter of this IIF() function is returned. Here, the second parameter is
Fields!Hub.Value
Therefore, if “Hub” is selected for the grouping, the value of the Hub field is used.
Finally, if “Hub” is not selected for the grouping, the value of the third parameter of this IIF() function is returned. Here, the third parameter is
Fields!City.Value
Therefore, if “Hub” is not selected for the grouping, the value of the City field is used.
We used sorting in different places to make sure that the report comes out the way we expect. We first specified a sort expression in the table grouping. This will sort the groups themselves so they come out in the proper order. We also used the Sorting tab in the Table Properties dialog box. This sorts the contents within each group, so they come out in the order specified by the user. If “Job” is selected for the grouping and “Emp Num” is selected for the sort order, the groups are first sorted by the Job field. Then, within each group, the rows are sorted by the Employee Number field.
In many cases, a report needs to start each new group on a new page. We used the Page Break at End option in the grouping properties to force the report to start a new page after each grouping. Page break options can be set before or after new groupings. Page breaks can also be set before or after a report item. For instance, you can force a page break before the beginning of a table or after the end of a table.
The Overtime Report
Features Highlighted
-
Implementing cascading parameters
-
Using SQL stored procedures
-
Using table filters
-
Using the NoRows property
Business Need The Galactic Delivery Services personnel department needs to monitor the amount of overtime put in at each of its repair and distribution hubs to determine when additional personnel must be hired. The personnel department needs a report that will list the employees with over 45 hours worked in a given week at a given hub. The report should have two sections. The first section should list employees with more than 45 hours and less than 55 hours worked for the selected week. The second section should list employees with more than 55 hours worked for the selected week.
The user should be able to select a work week from a drop-down list and then see a second drop-down list showing the hubs that have one or more employees with more than 45 hours for the selected week. The user will select a hub from this second list and then see the report for that hub.
Two stored procedures in the Galactic database should be used for retrieving data. The stp_HubsOver45 stored procedure will return a list of hubs with one or more employees who have over 45 hours worked for the selected week. The stp_EmployeesOver45 stored procedure will return a list of employees who have over 45 hours worked for the selected week at the selected hub. We will discuss stored procedures in the task notes.
Task Overview
-
Create a New Report and Three Datasets
-
Create the Report Layout
Overtime Report, Task 1: Create a New Report and Three Datasets
-
Reopen the Chapter07 project if it has been closed. Close the Employee List Report if it is open.
-
Right-click Reports in the Solution Explorer and select Add | Add New Item from the context menu. The Add New Item dialog box will appear.
-
Single-click GDSReport in the Templates area to select it. Change the name to Overtime and click Open.
-
Choose <New Dataset…> from the Dataset drop-down list. The Dataset dialog box will appear.
-
Enter Weeks for the name in the Dataset dialog box.
-
Galactic will be selected for the data source by default. Click OK. You will return to the Generic Query Designer in the Data tab.
-
Type the following in the SQL pane:
SELECT DISTINCT CONVERT(char(4), DATEPART(yy,WorkDate))+'-'+ CONVERT(char(2), DATEPART(wk,WorkDate)) as Week FROM TimeEntry ORDER BY Week
-
Run the query to make sure it is correct.
-
Choose <New Dataset…> from the Dataset drop-down list. The Dataset dialog box will appear.
-
Enter HubsOver45 for the name in the Dataset dialog box.
-
Galactic will be selected for the data source by default.
-
Select StoredProcedure from the Command Type drop-down list.
-
Click OK. You will return to the Generic Query Builder in the Data tab.
-
Select stp_HubsOver45 from the Stored procedure drop-down list in the Data tab toolbar.
-
Run the stored procedure to make sure it is functioning properly. When you run the stored procedure, Visual Studio will determine what parameters are required. Type 2004-15 for the @Week parameter in the Define Query Parameters dialog box and click OK.
-
Choose <New Dataset…> from the Dataset drop-down list. The Dataset dialog box will appear.
-
Enter EmployeesOver45 for the name in the Dataset dialog box.
-
Galactic will be selected for the data source by default.
-
Select StoredProcedure from the Command Type drop-down list.
-
Type stp_EmployeesOver45 for the query string.
Note You can select the stored procedure from the Stored procedure drop-down list in the Data tab toolbar or you can type in the name of the stored procedure yourself; whichever is most convenient at the time.
-
Click OK. You will return to the stored procedure version of the Generic Query Designer in the Data tab.
-
Run the stored procedure to make sure it is functioning properly. Type 2004-15 for the @Week parameter and BLNR for the @HubCode parameter in the Define Query Parameters dialog box and then click OK.
Task Notes: For two of our three datasets, we used stored procedures rather than queries. A stored procedure is a query or a set of queries that is given a name and stored in the database itself. You can think of a stored procedure as a data-manipulation program that is created and kept right inside the database.
Stored procedures have several advantages over queries:
-
Speed A certain amount of preprocessing must be done on any query before it can be run in the database. Stored procedures are preprocessed when they are created, and this preprocessing information is saved with them. This means that when you execute a stored procedure, you do not need to wait for the preprocessing. The result is faster execution time.
-
Simplicity A developer or database administrator can create a stored procedure that uses a number of intricate queries. When you execute the stored procedure, you do not need to understand, or even see, this complexity. All you need to do is execute the stored procedure to get the result set you need.
-
Security When you query a set of tables, you must be given rights to see any and all data in each of the tables. However, when a stored procedure is used, you only need rights to execute the stored procedure. You do not need rights to any of the tables being queried by the stored procedure. The stored procedure can then control which rows and which columns can be seen by each user.
-
Reusability A single stored procedure can be used by a number of reports. Therefore, complex queries do not have to be created over and over again when a number of reports need to use the same data.
-
Maintainability When changes are made to the database structure, the developer or database administrator can make the corresponding changes in the stored procedure, so the stored procedure continues to return the same result set. Without stored procedures, a change in the database structure could result in a number of reports needing to be edited.
For these reasons, it is often advantageous to use stored procedures rather than queries for your datasets.
| Note | Querying against database views has a number of the same benefits as stored procedures and is also a very good choice as the source for your datasets. Because querying views is much the same as querying tables (they present fields to the Query Builder just as tables do), we will not spend time discussing views. |
When you are using a stored procedure for your dataset, all you need to do is set Command Type to StoredProcedure and enter the name of the stored procedure. Visual Studio will figure out the parameters required by the stored procedure and add them to the report. Can’t get much simpler than that.
Overtime Report, Task 2: Create the Report Layout
-
Select the Layout tab.
-
From the main menu, select Report | Report Parameters. The Report Parameters dialog box will appear.
-
With “Week” selected in the Parameters list, change Available Values to From Query. The Dataset drop-down list should be set to Weeks.
-
Select HubCode from the Parameters list.
-
Change Prompt to Hub.
-
Change Available Values to From Query.
-
Select HubsOver45 from the Dataset drop-down list. Select HubCode from the Value field drop-down list. The Label field drop-down list should be set to Hub.
-
Click OK to exit the Report Parameters dialog box.
-
Place a text box onto the body of the report. Modify the following properties of this text box:
Property
Value
Font: FontSize
25pt
Font: FontWeight
Bold
Location: Left
0in
Location: Top
0in
Size: Width
2in
Size: Height
0.5in
Value
Overtime
-
Place a second text box onto the body of the report. Modify the following properties of this text box:
Property
Value
Font: FontSize
16pt
Location: Left
0in
Location: Top
0.5in
Size: Width
5.25in
Size: Height
0.375in
-
Right-click this text box and select Expression from the context menu.
-
Type the following in the Expression area:
= "Week: " & Parameters!Week.Value & " Hub: " & Parameters!HubCode.Value
-
Click OK to exit the Edit Expression dialog box.
-
Place a third text box onto the body of the report. Modify the following properties of this text box:
Property
Value
Font: FontSize
16pt
Font: FontWeight
Bold
Location: Left
0in
Location: Top
1.125in
Size: Width
5.25in
Size: Height
0.375in
Value
Employees with 45 to 55 hours for this week
-
Place a table onto the body of the report immediately below the third text box.
-
Select EmployeesOver45 from the drop-down box at the top of the Fields window.
-
Drag the EmployeeNumber field into the leftmost cell in the detail row of the table.
-
Drag the FirstName field into the center cell in the detail row of the table.
-
Drag the LastName field into the rightmost cell in the detail row of the table.
-
Right-click the gray bar above the rightmost column and select Insert Column to the Right from the context menu.
-
Drag the HoursWorked field into the cell in the detail row in the column you just added.
-
Right-click the gray square to the left of the footer row. Select Table Footer from the context menu to toggle off the table footer.
-
Select the table header row. Modify the following property:
Property
Value
TextDecoration
Underline
-
Select the leftmost table column. Modify the following property:
Property
Value
TextAlign
Left
-
Select the entire table and bring up the Table Properties dialog box.
-
Select the Filters tab.
-
Type =CStr(Fields!HoursWorked.Value) for the expression.
-
From the Operat… drop-down list, select “<=”.
-
Type 55.00 for the value.
-
Click OK to exit the Table Properties dialog box.
-
Modify the following property for the table using the Properties window:
Property
Value
NoRows
No Employees
-
Select both the table and the text box with the string “Employees with 45 to 55 hours for this week.” Press CTRL-C to copy these two report items.
-
Drag the bar between the report body and the page footer so that the report body is larger.
-
Press CTRL-V to paste a copy of the two report items. Drag the two new items so that they are below the originals.
-
Select the new text box. Change the value of the text box to “Employees with over 55 hours for this week.” (You can edit it right in the text box itself.)
-
Select the new table and bring up the Table Properties dialog box.
-
Select the Filters tab.
-
From the Operat… drop-down list, select “>”.
-
Click OK to exit the Table Properties dialog box. Your report layout should appear similar to Figure 7-12.
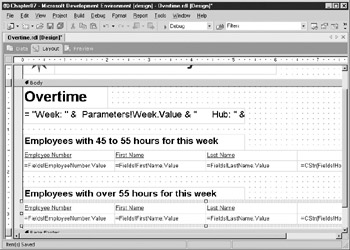
Figure 7-12: The Overtime Report layout -
Select the Preview tab.
-
Notice that the Week drop-down list is enabled, but the Hub drop-down list is disabled. Select 2004-15 from the Week drop-down list.
-
Once a week has been selected, the Hub drop-down list is enabled. Select Borlaron Repair Base from the Hub drop-down list. Click the View Report button. Your report should appear similar to Figure 7-13.
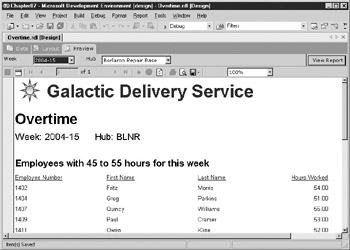
Figure 7-13: The Overtime Report preview -
Select 2004-10 from the Week drop-down list. Borlaron Repair Base will still be selected in the Hub drop-down list. Click the View Report button. Note the text under the “Employees with over 55 hours for this week” heading.
-
Click Save All in the toolbar.
Task Notes: In this report, we used the same dataset to populate two tables. We got different information in the two tables by applying different filters on each table.
The filter for the upper table on the report says that we only want records in this table where the hours worked is less than or equal to 55. The filter for the lower table on the report says that we only want records in this table where the hours worked is greater than 55. In this way, we were able to divide up the data in the dataset to fulfill the business requirements of the report.
You may have noted that we used the Visual Basic function CStr() to convert the hours worked to a string data type in our filter expressions. This is due to a quirk (some might call it a bug) in the operation of the filter expressions. Because of this quirk, filters deal much better with strings than they do with other data types. To get around this, we simply convert our numbers to strings, and everything works fine.
In addition to what you saw here, filters can be applied to data in other locations as well. A dataset can have a filter applied to it after it has been selected from the database. Individual groups within a table, matrix, or chart can also utilize filters.
Filters work well in situations like the one in this report where we want to use one dataset to provide a slightly different set of records to multiple data regions. They can also be useful for taking data from a stored procedure that provides almost, but not quite, the result set you need. It is usually best, however, to have your filtering done by your select query or stored procedure, rather than by the report. The reason is, in most cases, it is considerably faster and more efficient if the database does the filtering as it executes the query or stored procedure. It does not make sense to have your query select 1,000 records from the database if your report is going to filter out all but 10 of these records. Filters are a good tool to have; just remember to use them wisely.
In the Overtime Report, we used two drop-down lists to allow the user to select the parameters for our report. The Week drop-down list allows the user to select the week of the year for which the report should be run. This drop-down list is populated by the Week dataset. The Hub drop-down list allows the user to select the hub for which the report should be run. This drop-down list is populated by the HubsOver45 dataset. The HubsOver45 dataset requires a value from the Week drop-down list before it can return a list of the hubs with employees working over 45 hours for that week. In this way, the data that populates the Hub drop-down list is dependent on the value selected in the Week drop-down list.
Reporting Services is smart enough to recognize this dependency and act accordingly. If there is no value selected in the Week drop-down list, the Hub drop-down list cannot be populated, so it is disabled. Every time the selected value in the Week drop-down list changes, the Hub drop-down list is repopulated.
Finally, in this report we used the NoRows property of each of the tables. This property allows you to define a string that is output when there are no rows to populate the table. When the filter on the lower table in the report filters out all the rows in the dataset, the contents of the NoRows property are displayed. This is more helpful to the user than simply having a blank space where a table ought to be. The NoRows property is available on any of the data region report items.
EAN: 2147483647
Pages: 109