Working with Ideas
Overview
Purpose of these tools
Most of the value in a team's work lies in the ideas and insights generated during a project. The tools in this section will help your team generate, organize, and process ideas.
| Note |
There are many good resources available to teams on generating and working with "language data." We've included three that are used universally not only for their own sake but as part of many other tools that appear in this book. We encourage teams to investigate creativity tools and additional methods for decision making. |
Deciding which tool to use
- Brainstorming, below, basic guidelines for holding an idea-generating discussion. All teams will need this.
- Affinity diagram, p. 30, a way to organize a large set of ideas. Very helpful for any team after a brainstorming session, when analyzing customer comments, etc.
- Multivoting, p. 31, a method for identifying priorities or narrowing down alternatives. Helpful when you have more ideas than your team can reasonably handle.
Brainstorming
Purpose
To provide a group with a wide range of ideas around any topic
Why use brainstorming
- Brainstorming produces many ideas or solutions in a short time
- Brainstorming stimulates the creative thinking process
- Brainstorming helps make sure that all group members' ideas are considered
When to use brainstorming
Use brainstorming whenever your group wants to make sure a range of ideas are considered, including…
- Completing elements in a project charter
- Identifying customers to include in research
- Identifying potential causes to investigate
- Identifying types of data to collect
- Identifying solution ideas
How to brainstorm
- Review the problem definition
- Clarify the goal/question and provide any relevant information
- Give everyone a few minutes of silence to think about the question and individually write down some ideas
- For ease of consolidation later, have people write down their ideas on self-stick notes or cards (one idea per note or card)
- Encourage creativity; no idea is too outrageous for brain-storming
- Gather ideas
- Do a round robin, where people state one idea at a time, or do an open "popcorn," where anyone can speak up at any time.
- Capture every idea…
- If ideas are written on self-stick notes, post them on the wall, board, or flip chart
- Alternatively, have each person read one idea aloud so a scribe can write it on a flip chart posted where everyone can see it
- If doing cause analysis, post the ideas on a blank cause-and-effect diagram (this helps make sure all categories are considered)
- Do not allow discussion until after all ideas are gathered; allow only questions of clarification. ("By ‘important’ do you mean to us or to our customers?")
- OK for people to write down or add new ideas sparked during the sharing session. Make sure the new idea is captured on both the flip chart and on a self-stick note.
- Continue until everyone is out of ideas.
- Consolidate similar ideas and discuss the complete set of ideas. Use other tools as appropriate:
- To find patterns, use affinity diagrams (p. 30), or cause-and-effect diagrams (p. 146)
- To narrow down or prioritize items, use Multivoting, p. 31
Brainstorming DOs and DON Ts
DO…
- Go for quantity (not necessarily quality) in the early rounds
- Allow individuals to complete their thoughts
- Build on existing ideas
- Be brief when stating an idea
- Organize, categorize, and evaluate only after the brainstorming session
- Keep the self-stick notes even if you transcribe ideas onto a flip chart (the self-stick notes can be reused for creating an affinity diagram)
DON'T…
- Criticize ideas (do not allow "idea assassins")
- Make judgments as ideas are being offered
- Paraphrase an individual's idea when scribing
- Allow any one person to dominate the session
Affinity diagrams
Purpose
To organize facts, opinions and issues into natural groups to help diagnose a complex situation or find themes
Why use an affinity diagram
- To help organize a lot of ideas
- To help identify central themes in a set of ideas
- When information about a problem is not well organized
- When a breakthrough is needed beyond traditional thinking
When to use affinity diagrams
- Use to organize ideas from a brainstorming session in any phase of DMAIC
- Use to find themes and messages in customer statements gleaned from interviews, surveys, or focus groups
How to create an affinity diagram
- Gather ideas from brainstorming session, or customer need statements from interview transcripts, surveys, etc.
- Write ideas on cards or self-stick notes (one idea per card; stay as close to original language as possible).
- Post self-stick notes randomly on a board or flip chart; if using cards, place them randomly on a table top.
- Allow people to SILENTLY start grouping the cards or notes.
- It's OK to move notes or cards that someone else has already moved. If you cannot agree on where an idea belongs, write a duplicate note and put it in both groups
- Silence is critical!—don't let the talkers sway the non-talkers
- When the clustering is done, create a "header" label (on a note or card) for each group.
- Work through the groups one at a time
- Ask participants to interpret what they see
- Ask them to suggest a label or key theme for that group
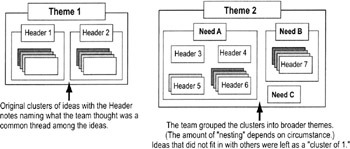
- Write the theme on a larger self-stick note or card (the "Header") and place it at the top of a cluster
- Continue until you've labeled all clusters
- OPTIONAL: Do a second round of clustering if desired. Clip together all the cards or notes from each cluster with only the Header labels showing. Then move the Headers into groups. Create "Master" header labels for the larger clusters.
- Complete the diagram and discuss the results.
- How will the patterns you've found influence your actions?
- If you're working with customer need statements, move into developing requirements based on those needs. May want to separate the needs based on the Kano Model categories (p. 66) before starting.
Multivoting
Highlights
A quick technique for identifying priorities or at least narrowing down the options from a list of ideas
To use multivoting…
Prework: This method assumes you have an existing list of ideas or options. Eliminate duplicates and combine related ideas before continuing.
- Number every idea or option being considered
- Write each idea on a flip chart or whiteboard visible to all participants
- Decide how many votes each person will have
- Rule of thumb: Participants should be able to cast multiple votes equal to about 1/3 of the total number of items on the list (Ex: 33 items on the list = 11 votes per person)
- Cast votes
- Decide if people can cast more than one vote for an item or if they must split their votes between items.
- Easiest method: Give everyone a marker and have them go to the flip chart or whiteboard and mark their votes.
- Confidential method: Have people write down on a slip of paper the numbers of the items they are voting for. Collect the slips and mark the votes on the flip chart or whiteboard.
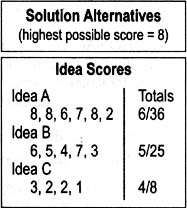
- Count votes
- Tally the votes and record the totals next to each item
- Decide on a course of action
- Identify the top vote-getters
- Eliminate from consideration all ideas with few or no votes
- OPTIONAL: If the list of top vote-getters is still too large for your purposes, do a second round of multivoting using only those top vote getters. (Ex: First round of votes on a list of 33 items identified 12 top vote-getters; do a second round on those top 12, this time giving only 4 votes each)
The Lean Six Sigma Pocket Toolbook A Quick Reference Guide to Nearly 100 Tools for Improving Process Quality, Speed, and Complexity
- Using DMAIC to Improve Speed, Quality, and Cost
- Working with Ideas
- Value Stream Mapping and Process Flow Tools
- Voice of the Customer (VOC)
- Data Collection
- Descriptive Statistics and Data Displays
- Variation Analysis
- Identifying and Verifying Causes
- Reducing Lead Time and Non-Value-Add Cost
- Complexity Value Stream Mapping and Complexity Analysis
- Selecting and Testing Solutions
EAN: N/A
Pages: 185
