Black Box (Functional) Testing
Now that we have considered some of the different forms overflows might take and where to look for them, let s turn our attention to how to find them in what we are testing once we identify a feature to test. To begin with, we focus on the process of examining what the data that the application expects looks like. By using expected data as a template, along with your understanding of how the system works and how overflows work, you can then dig more deeply into methods to construct meaningful data for use in finding overflows.
Determining What Data Is Expected
The first item to understand about the entry point under consideration is what data the system expects and in which format the data is expected to be. If you want to do a thorough job of breaking the system, you have to break down and test each of the separate pieces of data in appropriate ways.
A variety of different ways can help you begin to understand what data is expected:
-
Data format standards and/or specifications
-
Talking with people who know (programmers and designers)
-
The source code for the application (original or disassembled)
-
Analyzing the binary data format
Understanding how to analyze the actual data format is a valuable skill because specifications are not always complete, error-free, or up-to-date, and people seldom know all of the details. The only consistently reliable and credible sources of information about the formats of the data are the source code, the actual compiled binary, valid chunks of data consumed by them, and proven exploits. Many security bugs are caused by different interpretations of the specification or standard and the assumptions that following vague standards engender.
| Important | Attackers don t necessarily have to understand the whole data format to get some good test cases, but testers do need to understand the whole data format to nail all of the good test cases. To exploit the system attackers need testers to miss only one case. |
Many good bugs are found by attackers hypothesizing what the code looks like, and then constructing data input experiments that either prove or disprove the hypothesis, enabling them to further refine their attack. Consider, for instance, the scenario in which a Web browser has a flaw in how it parses the HTML returned from the server. Perhaps that Web browser fixes the flaw. A sharp attacker would realize that other Web browsers need to write code to do something similar. Maybe the other browsers have the same bug. It can be very embarrassing for a company to fix a bug in one piece of code only to have the attacker try the same exploit someplace else and find that code vulnerable.
Using Data You Recognize
Start out using data that you recognize, such as all A bytes (0x41), that matches the characteristics of the data being replaced . If it is numeric data, for example, use numeric replacements you can recognize (all number 2 s, for instance). The reason for using data you recognize is so you can later tell whether you see your data in CPU registers, on the stack, and in places it shouldn t be.
| Tip | To determine whether all of your test data was copied , vary the last four bytes or so, still in a recognizable way. For example, aaaaaaaaaaaaa aaaaaaaAAAA enables you to tell quickly whether the whole string was copied without having to count the long string later on. |
Knowing the Limits and Bounds
One of the main issues when testing for buffer overflows is trying to figure out how long of a string to try. You can employ a number of strategies to determine this.
Asking or Reading the Code
The first approach is the most direct. If you ask the programmer, he or she might tell you an incorrect answer or might not know the answer. Asking developers can give you some hints, but you shouldn t rely on that method exclusively.
Reading the code is only slightly better because, in reading the code, it is easy to misread thereal boundaries, although you might notice some overruns in the code you are reading. Properly determining the boundaries while reading the code requires understanding the system state (with respect to that data) for every equivalence class, in every environment, for the whole code base (every caller) that applies to that data. That s appropriate to tackle for anin-depth code review, but for penetration testing all you should try to get from developers and the code is a clear idea of the maximum size this data is intended to be. We always ask, think about, and compare the length in bytes; otherwise , there is too much ambiguity and confusion.
Trying the Maximum Intended Allowable Lengths
If you do know how long data can be, you need to try the maximum allowed length, as well as one byte longer, to get a feel for the accuracy of your information and whether the code allows enough memory for the trailing null. If the actual allocated space is larger and we know its size, it is worth hitting that boundary as well, looking to see whether the allowed length is enforced even given a larger buffer.
Using Common Limits
A lot of defined numerical limits are well known because shared code, such as C header files, defines the limits. These limits can help you out. You can use an Internet search engine or programmers references or look in the include files for well-known or commonly used limits. As you look for overflows, build up a list of common limits to keep in mind given the kinds ofdata the application uses. Some of the more common limits might include the following (look around and add your own to the list):
//from stdlib.h /* Sizes for buffers used by the _makepath() and _splitpath() functions * Note that the sizes include space for 0-terminator. */ #define _MAX_PATH 260 /* max. length of full path */ #define _MAX_DRIVE 3 /* max. length of drive component */ #define _MAX_DIR 256 /* max. length of path component */ #define _MAX_FNAME 256 /* max. length of filename component */ #define _MAX_EXT 256 /* max. length of extension component */ //from WinGDI.h /* Logical Font */ #define LF_FACESIZE 32 #define LF_FULLFACESIZE 64 //from wininet.h // maximum field lengths (arbitrary) // #define INTERNET_MAX_HOST_NAME_LENGTH 256 #define INTERNET_MAX_USER_NAME_LENGTH 128 #define INTERNET_MAX_PASSWORD_LENGTH 128 #define INTERNET_MAX_PORT_NUMBER_LENGTH 5 // INTERNET_PORT is unsigned short. #define INTERNET_MAX_PORT_NUMBER_VALUE 65535 // maximum unsigned short value #define INTERNET_MAX_PATH_LENGTH 2048 #define INTERNET_MAX_SCHEME_LENGTH 32 // longest protocol name length #define INTERNET_MAX_URL_LENGTH (INTERNET_MAX_SCHEME_LENGTH \ + sizeof("://") \ + INTERNET_MAX_PATH_LENGTH) //from winbase.h #define OFS_MAXPATHNAME 128 #ifndef _MAC #define MAX_COMPUTERNAME_LENGTH 15 #else #define MAX_COMPUTERNAME_LENGTH 31 #endif //from wincrypt.h #define CERT_CHAIN_MAX_AIA_URL_COUNT_IN_CERT_DEFAULT 5 #define CERT_CHAIN_MAX_AIA_URL_RETRIEVAL_COUNT_PER_CHAIN_DEFAULT 10 #define CERT_CHAIN_MAX_AIA_URL_RETRIEVAL_BYTE_COUNT_DEFAULT 100000 #define CERT_CHAIN_MAX_AIA_URL_RETRIEVAL_CERT_COUNT_DEFAULT 10 Slowly Growing the Input
Once you know the limit, you must slowly grow the string or the number of items. The main reason you must slowly increase the string is because in stack overruns it isn t clear how much data resides between the buffer being overrun and the interesting items to overwrite on the stack. Growing the string slowly means trying one more byte/character with each successive test case. The most efficient way of testing this scenario, of course, is to write a script or tool that can do the work for you. But the test automation must be able to discern changes in the application s response accurately to determine where the real boundaries are successfully.
Using an Iterative Approach
When you get a new feature from the programmers and begin looking for overruns, one of the first steps you can take is to try to assess what the intended maximum lengths of various data components are. The programmers should absolutely know attackers will look for this and keep that in the back of their minds as they write code.
Once you identify all of the data you control as an attacker, systematically break down the data into appropriate chunks. For each chunk , try expected boundaries, one byte over, two bytes over, four bytes over, and in this way grow the string. If you get the same response for allof the inputs, moving on to the next chunk of data seems reasonable. For the riskiest data, write automation to grow the string slowly, and gauge application responses for different lengths of input. If you get different responses, focus on the exact boundary where the difference occurs and perhaps you will discover a region in between where an overflow is exploitable.
Consider the case in which the program allocates 20 bytes, and the programmer tries to validate that the input is 20 bytes or fewer. Then the programmer tells the computer to copy the input into the 20-byte buffer and append a null byte immediately following the copied data. If the input data is 19 or fewer bytes, all works well. If the input data is 20 bytes, the null appended is written past the end of the allocated buffer. If the input data is 21 or more bytes long, the data is correctly validated and rejected. In this case, the only test case that would findthe bug is specifying exactly 20 bytes. Drilling in on boundaries like these is important. Don t just throw hundreds or thousands of bytes in a buffer and call it good or you ll miss important cases like this one.
It isn t unusual for comparison errors to cause overruns. Comparison errors occur when theprogrammer mistakenly uses the wrong comparison operator: a less than comparison operator (<) should have been used instead of the less than or equal to comparison operator (<=). Overrunning the boundary by 1 byte and 1 character is all that is necessary for many overflows to be exploitable.
Maintaining Overall Data Integrity
The main point of purposefully constructing test cases is to drill deeply into the application functionality and start to poke. If you make a key to open a lock and the key is constructed such that the end doesn t even fit in the keyhole , you cannot tell whether the key otherwise would have opened the lock. In the same way, you must be careful to distinguish between whether the basic validations the program performs on the data are still true about the test data. If your testing is merely confirming that those validations are still functional, your tests are of little value in finding real weaknesses in the deeper algorithms.
This section includes a few examples of what to watch out for when constructing test data. Maintaining data integrity warrants looking at each of the following instances within the overall data and considering how the data needs to change to maintain validity.
Encodings/Compression/Encryption
If you know the data is in the file but do not find it in plain text, the data is likely encoded, compressed, or encrypted. We refer to data not immediately available as encumbered data. One of the main tasks here would be to figure out which parts of the data are encumbered and which parts are not. From there, to alter anything encumbered would require appropriate tools. Usually, common libraries, API function calls, or freeware/open source resources are available. So even if the tools do not already exist, developing them might be easier than it sounds at first. Occasionally, a vendor provides tools that can be helpful on its support site or in a software development kit (SDK).
Perhaps one of the most universally applicable approaches to working with encumbered data is to use the application as the tool: you can run the native application in a debugger and view and alter the data in memory before it is encumbered. Using the application itself has some problems, however. First, you need to determine where and when that application makes the call to encrypt, encode, or compress its data before storing it in a file or sending it over the wire. If you don t have the source code, disassembling the binary and running tools such as strace ( http:// sourceforge .net/project/showfiles.php?group_id=2861 or http://www.bindview.com/Services/RAZOR/Utilities/ Windows /strace_readme.cfm ) and APIMon ( http://www.microsoft.com/downloads/details.aspx?familyid=49ae8576-9bb9-4126-9761-ba8011fabf38&displaylang=en ) are attractive options. Then you need to set a breakpoint in the debugger to tamper with the data in memory before the application encumbers the data. It seldom is that simple, however. Usually the application won t let you create the bad data for a variety of reasons:
-
Data validity checks fail ”these must be removed.
-
Sufficient space to grow the buffer adequately has not been allocated ”you need to allocate more by figuring out how the allocation happens and making sure more space is allocated.
-
The data is no longer consumable by the routine used to encumber the data ”you need to modify the encumbering routine (perhaps as a separate program) to handle the test data. For example, the data is null terminated and you introduce a null byte or character in the middle of the data. In this case, you would need to fool the routine into thinking the data really was longer than the inserted null is in places where it computes or uses the length of the data.
-
Other metadata about the encumbered blob ”for example, the length of the blob or other characteristics that are checked when the blob is subsequently processed ”is no longer valid ”those characteristics might have to be updated to fool the data validation check.
-
The application includes checks to detect whether a debugger is attached to prevent attackers from generating bad data and analyzing how the application works. As discussed in Chapter 17, Observation and Reverse Engineering, applications that include checks to prevent reverse engineering can be defeated.
Compound Documents
If you look at the data and see the Root Entry , such as in the file shown in Figure 8-11, the data is likely to be formatted as an Object Linking and Embedding (OLE) DocFile, also called a structured storage file. This text is present in OLE DocFile compound storage files when they are viewed with a binary editor.
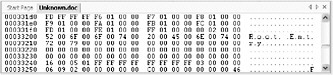
Figure 8-11: The Root Entry text
Although testers can write code to create test cases (see StgCreateStorageEx and related APIs), a handy tool from eTree can be used to edit these files (go to http://www.etree.com/tech/freestuff/edoc/index.html ).
Offsets/Sizes
It is not at all uncommon for structures that contain the length of data, how many items there are to read, or the offset to another piece of the data to be written into the file. For these situations, several cases are worth trying:
-
When growing the data, you might also need to grow the size or offsets specified in the file to maintain overall file integrity.
-
Specify offsets and lengths that are huge (0xFFFFFFFF for the unsigned 32-bit case, for example, or 0x7FFF for the signed 16-bit case).
-
Determine which piece of input is responsible for the memory allocation. For example, if there is more than one place where the data length is specified, specify large amounts of data and watch the amount allocated in System Monitor (perfmon.msc) or by setting a conditional breakpoint on the memory allocation routine. By doing so, you can determine which numbers need to be altered for test case generation.
References
Sometimes the data includes references to other pieces of data, and the references must be valid for the processing of the file to continue.
One example of this is in valid Extensible Markup Language (XML) syntax, where a corresponding closing XML tag is expected for every open tag. If the closing tag is not encountered , the parent and child XML node relationship is messed up or the file fails during parsing, and the data is never really processed deeply by the application of interest.
Another example is a database in which the name of a table or field is present in a query. If the parsing of the query checks for the existence of the table and field, the parser might stop unless the table or field is also present, of the right type, and so forth.
Fixed-Width Fields
Many data files have fixed field widths, which might have to be respected for the parser to interpret subsequent data in a meaningful way.
Consider, for example, a phone number parser that lists _8005551212 as a chunk of data. Someone more familiar with the parser might realize that the data is really two pieces: the 3-digit area code (800), and the 7-digit phone number (5551212). Each piece has its meaning, and perhaps making these fields longer doesn t even get past the parser. How would you try to overrun, say, a list of phone numbers? You could try integer overflows and providing too many phone numbers, but generally fixed-width data is harder to overflow unless the width is also specified in the document. It can be worth inserting all zeros, nonnumeric data, or expressions that might expand to fill more space when evaluated and setting the sign on data (refer to the section Integer Overflows earlier in this chapter).
Limited Values (Enumerations)
Often, particular values are acceptable and all other values are not. Knowing what type of information is present matters: consider HTTP, which has a certain number of valid commands: GET, POST, and HEAD, for example. In the case of credit card numbers, perhaps the data parser takes only the digits 0 to 9. Other times, there is an enumeration of values. In the database case, perhaps the first byte of data is 0 for database name, 1 for table name, 2 for field name, 3 for query name. If it is not 0, 1, 2, or 3, the field takes some other code path that isn t well defined, or perhaps the parsing stops at that point. In that case, you would want to ensure the data is 0, 1, 2, or 3 to test the first code path and some other value to test the other code paths. If the character size limit on the table name is 32, overflowing this limit would be the target when the enumeration is 1. If the database name could be only 16 characters long, when the enumeration is 0 you would have a different boundary to check against for overruns.
Dependencies
Many times there are optional chunks of data. If an HTML document contains a table, the <table> tag is present, and so are <tr> and <td> usually. If there is a <tr> or a <td>, the <table> element is expected to define the overall properties of the table as a whole.
Suppose in the database example the database definition input parser sees the type of the field and expects certain data to be present about the contents. Likely, the parser infers a specific format from the type as well. Numeric data will probably be within a certain range, of a certain length; character data (strings) will either be null terminated or have a length listed with them, and so forth.
In the embedded content case, a single null byte (0x00) might be sitting someplace to indicate there is no embedded content. When that value is changed, the application begins to infer other data about the embedded object should be present. To make any real use of changing that byte, a better understanding of how the embedded data is represented for that case is warranted. Sure, you can go around and change the byte and see what happens and perhaps find a few basic issues ”but to really dig in and overflow metadata about the embedded object or data within the object itself and encounter overruns in the deeper underlying parsing algorithms for the object, you need to understand how that object is stored.
Delimiters
Don t just focus on the data: manipulating the delimiters and format of the data is important. For example, when trying to overflow strings that are paths, trying a lot of path separators is different from simply trying other characters. When overflowing a Simple Object Access Protocol (SOAP) request, it s fair game to try to overflow the SOAPAction header or put in a long attribute name.
If you see the data quoted, you should try to knock off the end quotation mark. Carriage return/ line feed (CR/LF) combinations (0x0D0A) should be bumped down to just one of the two or none ”really see what happens when a list like {x,y,z} is changed to {x,yaz} or {x,,,,} . Adding extra delimiters can be interesting. Also, try leaving off the final brace . Don t forget nested cases, too {{}} .
Null values are a special case covered in the following section.
Strategies for Transforming Normal Data into Overruns
In addition to maintaining data integrity, you can employ a number of strategies to take existing data and turn it into interesting test cases:
-
Replacing null values
-
Inserting data
-
Overwriting data
-
Adjusting string lengths
-
Understanding more complex data structures
Replacing Null Values
Null values are great. They can indicate a lot of different things: flags that are not set, zero, an empty string, the end of a string, or filler. One good brute force test case is to replace the nulls (one, two, or four at a time, depending on the expected size of the data) with 0xFF, 0xFFFFFFFF, or other valid data. Why is this interesting? If the null indicates the end of a string and it is replaced with 0xFF, the string becomes longer without disturbing any offsets or other data. If the null indicates length, 0xFF is a good case to try for integer overruns. Note that sets of three null bytes often can indicate the null bytes are really part of a 4-byte value. For this case, editing the null s is really just changing the value from one nonzero value to another nonzero value.
Inserting vs. Overwriting
When you generate test cases using a well- understood data format, how to adjust the remaining data to accommodate the overflowed value is clear. If, on the other hand, you do not understand the data format well, it becomes interesting to try the following different cases on strings in the binary data:
-
Overwriting data
-
Inserting data
-
Replacing data
To overwrite means to change existing data within and/or after the data without extending the overall length of the data. In this method, some data is overwritten. This is particularly valuable as an approach if earlier parts of the file might reference later parts by location.
Inserting implies increasing the length, which is useful in several cases. The first case is when you are fairly certain no reference by location will be affected. Another case is when there are specific delimiters of interest. Inserting data is generally worth trying, in any event.
Replacing data is done by removing the existing data or a portion thereof and then inserting the test case data in its place. Replacing data is particularly useful in data formats with delimiters, such as XML and other text-based formats, null-terminated strings, and so forth.
Inserting is particularly useful when the beginning or end of the data needs to be preserved. For example, if you can overflow the filename but need to preserve the extension as .pem to hit a particular place of interest in the code path, inserting data prior to the .pem extension is the method of choice for initial test cases. Figures 8-12, 8-13, and 8-14 show examples of using a binary editor to insert and overwrite additional data to grow the string present in the original data.
Figure 8-12: Binary data in the format the program expects
Figure 8-13: Inserting data to lengthen the string using a binary editor
Figure 8-14: Overwriting data to lengthen the string using a binary editor
In Figure 8-12, the file contains valid binary data in the format the program expects, but some of it looks interesting to test for overflows. Figure 8-13 shows data that was created by taking ordinary input (shown in Figure 8-12) and inserting data before the .pem extension to lengthen the string using a binary editor. The test data shows only 16 bytes inserted; in practice, the quantity of data inserted would vary. Figure 8-14 shows data that was created by taking ordinary input (shown in Figure 8-12) and overwriting data to lengthen the string using a binary editor. Notice that in Figure 8-13 the path $\ User \Certs is still present, as is the extension (.pem), unlike in Figure 8-14.
Most binary and text editors have facilities for performing insertion, overwriting, and replacing of arbitrary data.
Adjusting String Lengths
It is fairly typical for the length of the data to be specified in the data itself. The length data can take one of two forms: it can be text data, such as Content-Length: 5678 in an HTTP packet, or it can be binary data, such as 0x000001F2 located in the binary file.
The main approach to testing string lengths is to alter the length specified by lowering it in the hopes that the program uses the length to allocate memory and copies all of the data anyhow, overflowing the buffer. Another case worth trying is the integer overrun case where perhaps the length is stored in a variable of a certain size. By specifying a larger length, it might be possible to convince the program to allocate a small amount of memory and copy the bits. A third case is to specify large sizes in the attempt to get the memory allocation to fail. If the allocation fails, perhaps the program doesn t check for this case and overwrites, or perhaps the program frees the unallocated buffer.
Recognizing Data Structures
It is important to understand the significance of each piece of data to do a reasonably thorough job of assessing the program for buffer overruns of various types. In the cases where the data format is documented ( http://www. wotsit .org lists many formats) or you have access to the code that parses or emits the data, it is relatively easy to understand the format of the data. When you do not understand the data, however, you can employ several strategies to gain insight.
A discussion of analyzing file formats and binaries is included in Chapter 17, but for overflows it isn t unusual to see patterns that involve the length preceding the data or the length of a structure appearing prior to the structure.
Testing Both Primary and Secondary Actions
Some code runs more frequently than other code. Primary actions are actions taken on untrusted data immediately, and always take place. Secondary actions take place after primary actions and might not actually take place. You still need to test secondary actions because they can be exploitable as well. For example, you might postulate that incoming network traffic on a port (primary action) that causes a server to overflow is worse than an overflow when printing a document (secondary action) in a word processor. Although the exposure is greater in the former case, the printing bug is still severe and warrants fixing. Perhaps users experience no problems when they open the document (primary action), but when they save the document (secondary action) there is a buffer overrun. In the network server case, maybe the first network request creates a file on the server and the second requires the file to be present but overflows. Maybe the buffer overflow occurs when parsing the data from the backend database, but the code that first puts the data therein is free from overflows. Upon reflection, the test matrix here is huge: consider every place you inject data, grow the strings slowly, and test the full functionality of features that might use the data. Whew ”how do you accomplish this?
Prioritizing Test Cases
The immediate issue arises of how to prioritize. The prioritization question is answered by the data flow and gaining some sense of how much handling of the data is done in the code paths available to the attacker. For converting to one format, perhaps the data is handled quite a bit, whereas for saving in a different format, it isn t handled much and so there is less risk. You need to assess the risk and weigh the alternatives of trying one piece of data in more places versus trying out more pieces of data in fewer locations, just like with every other type of testing. We already discussed one key indicator of risk (how much the data is handled), but it turns out there are at least a few more indicators of high risk:
-
Poor development practices.
-
Borrowed code.
-
Pressure on the development team to meet the due date instead of focus on quality.
-
The programming language used. Languages such as C, C++, and assembly are inherently riskier than are such languages as Java and C#.
-
No static or runtime overrun analysis tools used, or results aren t investigated.
-
Little or no code review by qualified people.
-
New developers.
-
Poor design (didn t specify boundaries and limits, hard to determine data types, and so forth).
-
Code has a history of other overflows.
-
Lack of secure coding practices in place, perhaps missing opportunities to reduce mistakes. Examples of insecure coding practices include not using secure string classes, relying on null termination rather than explicitly specifying the maximum sizes of the target buffers, and failing to specify the string length explicitly rather than by using null termination or parsing.
-
Programmers have little or no awareness of security issues.
-
Existing security testing coverage of the code is poor.
From a purely technical point of view, you can also look at how many copies of the data are needed to get the job done. The more copies needed, the more likely there will be an overflow. The more the data is parsed, the more likely there will be an overflow. So as you examine which features and functionality pose the greatest risk, carefully consider which types of actions (parsing, copying, converting, inserting/appending, or sending unvalidated data to other components) cause the overflows.
What to Look For
All the test cases in the world will never find a single overrun if the observer is unaware of what overruns look like. Some people think overruns cause crashes. Although that might be true for some cases, it is often true that overruns do not cause crashes.
| Important | Any exploitable overrun in the hands of a skilled attacker who does not wish to be caught will almost never crash. If you ever hear it didn t crash, so it is not exploitable, with no additional analysis, you know the person making that claim does not understand overruns. |
In addition to crashes, overruns can throw other exceptions that are handled or cause memory spikes and other unexpected behavior.
Learn programmer lingo. Sometimes random heap corruption bugs turn out to be exploitable heap overruns. They can be very hard to track down, but are usually worth pursuing.
Crashes
In general, if ordinary input works fine and long input or other test cases targeted at overruns crash the program, a buffer overrun is indicated until code analysis mathematically proves otherwise. It is typically far less expensive to fix these problems than it is to prove they are not exploitable. Many programmers have proved certain cases were not exploitable only to have an attacker exploit the situation by violating incorrect assumptions (the programmer s proof was not mathematically robust for all input in all operating environments).
When a crash occurs, a number of factors indicate an exploitable condition. Look at the CPU registers. If the attacker s data is all or part of EIP, EBP, or ESP, the overrun is considered always exploitable. If the attacker s data is all or part of one or more of the other CPU registers, the bug is very likely to be exploitable, although only further analysis can really determine whether that is so. If EIP, ESP, or EBP is pointing to memory the process does not own, the case is extremely likely to be exploitable ”the program lost control because of the input.
Look at the stack. If the stack is corrupted, you ve likely got an exploitable overrun. If the stack isn t corrupted, you can use it to help analyze what happened . If the overrun happens during a free or delete operation or a Component Object Model (COM) pObject->Release(); call, a double free bug might well be present. If the stack indicates some sort of memory copy or move condition, it is likely to be an exploitable heap overrun.
Consider the type of exception that was thrown. Write access violations (write AVs) occur whenthe program attempts to write to memory it does not own or memory that is marked execute-only or read-only. Read access violations (read AVs) occur when the program attempts to read memory to which it does not have Read access. Although people might correctly say that write AVs are more likely to be exploitable than read AVs are, many read AVs are exploitable in subtle ways. Look at the code about to be run. If the code about to be run is mov [ecx], [eax] , for example, and an attacker can influence ECX or EAX, likely an exploit is possible.
One particularly common pattern is for an instance of a class to be allocated on the heap, and then later freed. When the class instance is freed, the pointer to the class instance is set to null . Then the program uses the class and causes a read AV referencing a very low memory address. It turns out these are exploitable in certain race conditions (refer to Chapter 13, Finding Weak Permissions, for more information about race conditions) if there is a context switch, for example, between deleting the object and setting the now unused object (class) pointer to null . In the meantime, if another thread allocates the same heap location and fills it with the attacker s data, what appears to have been a crash turns out instead to be an exploitable security vulnerability because the function pointer is located on the heap in the attacker s data.
Exceptions
In most examples in this book, we identify overruns by entering long data and watching for unhandled exceptions and crashes, but some programming teams have a methodology whereby they use exception handling excessively to handle error cases in general. Not only do exception handlers make it somewhat harder to notice buffer overruns, it turns out the exception handling routines can be useful for attackers. Let s examine how simple exception handlers work to see them in action. Consider the following program.
int _tmain(int argc, _TCHAR* argv[]) { try { throw 2; } catch (...) { printf("Exceptional Code.\n"); } return 0; } | Note | This walkthrough is done using ship/release (not debug). |
To follow along, set a breakpoint on the _tmain function, start the program, and when the breakpoint hits you can right-click the code window and select Go To Disassembly from the shortcut menu. Note that you can also enable code bytes by right-clicking the Disassembly window and selecting Show Code Bytes from the shortcut menu if it is not selected already.
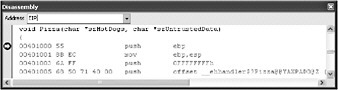
Switching to disassembly shows us the following:
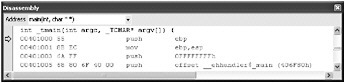
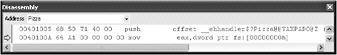
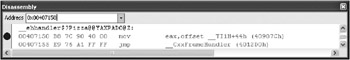
So what is all of this? Well, it appears register EBP is being properly set up and the old value is pushed onto the stack; then comes offset__ehhandler$_main (406F80h) . This means that the address where the exception handler code is located is pushed onto the stack. Let s look at 406F80h in the Disassembly window to confirm:
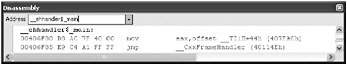
This seems like interesting code because it looks likely all exception handlers might use this location. Put a breakpoint on 0x00406F80 while you are there.
Back in the main function s disassembly, step in the debugger a few times until you are just past the push offset__ehhandler$_main instruction:
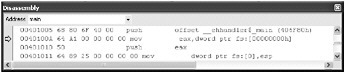
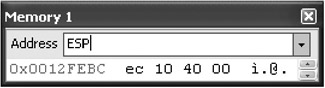
In the Memory window, type ESP to look at the stack:
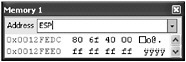
Notice the 80 6F 40 00 in memory. This is stored in little endian notation (meaning it is stored backward). The memory, when converted to an address, is 0x00406F80. Address 0x00406F80 is on the stack. Now run, and the breakpoint triggers when the exception occurs. Stop the debugger for now. This is interesting because it turns out to be somewhat handy to overwrite the exception handler if your data cannot be long enough to reach the return address of the function or you can easily trigger an exception. Sometimes, to fix a bug, the programmer might simply use try-catch blocks rather than addressing the issue. This does not stop buffer overflows from occurring, and it does not stop them from being exploitable.
Let s consider an example of exception handlers and the associated overflows and some issues to be on the lookout for when testing.
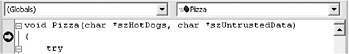
Consider the following program.
#include <iostream> #include <tchar.h> void Pizza(char *szHotDogs, char *szUntrustedData) { try { size_t DataLength = strlen(szUntrustedData); //messed-up code here mbstowcs((wchar_t*)(szHotDogs - DataLength), szUntrustedData, DataLength + 1); //Bad News throw 2; } catch( ) { } } int _tmain(int argc, _TCHAR* argv[]) { char szFoo[21]; char *szUntrustedData = (char*)malloc(201); if (!szUntrustedData) return 1; //Simulate loading untrusted data from somewhere. memcpy(szUntrustedData,"aaaaaaaaaaaaaaaaaaaaaaaaaaaaaaaaaaaaaaaaaaaaa" "aaaaaaaaaaaaaaaaaaaaaaaaaaaaaaaaaaaaaaaaaaaaaaaaaaaaaaaaaaaaaa" "aaaaaaaaaaaaaaaaaaaaaaaaaaaaaaaaaaaaaaaaaaaaaaaaaaaaaaaaaaaaaa" "aaaaaaaaaaaaaaaaaaaaaaaaaaaaaaa #include < iostream > #include <tchar.h> void Pizza(char *szHotDogs, char *szUntrustedData) { try { size_t DataLength = strlen(szUntrustedData); //messed-up code here mbstowcs ((wchar_t*)(szHotDogs - DataLength), szUntrustedData, DataLength + 1); //Bad News throw 2; } catch( ) { } } int _tmain(int argc, _TCHAR* argv[]) { char szFoo[21]; char *szUntrustedData = (char*)malloc(201); if (!szUntrustedData) return 1; //Simulate loading untrusted data from somewhere. memcpy (szUntrustedData,"aaaaaaaaaaaaaaaaaaaaaaaaaaaaaaaaaaaaaaaaaaaaa" "aaaaaaaaaaaaaaaaaaaaaaaaaaaaaaaaaaaaaaaaaaaaaaaaaaaaaaaaaaaaaa" "aaaaaaaaaaaaaaaaaaaaaaaaaaaaaaaaaaaaaaaaaaaaaaaaaaaaaaaaaaaaaa" "aaaaaaaaaaaaaaaaaaaaaaaaaaaaaaa\0",201); if (strlen(szUntrustedData) > 200) { free(szUntrustedData); return 1; } //Do something interesting with the data. Pizza(szFoo,szUntrustedData); free(szUntrustedData); printf("Run completed successfully."); return 0; } ",201); if (strlen(szUntrustedData) > 200) { free(szUntrustedData); return 1; } //Do something interesting with the data. Pizza(szFoo,szUntrustedData); free(szUntrustedData); printf("Run completed successfully."); return 0; } Go ahead and run the program (use release, not debug). No crash, but the program results in something suspicious. Look at the debug output window.
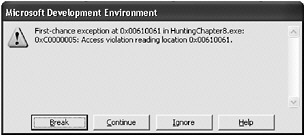
First-chance exception at 0x00610061 in HuntingChapter8.exe: 0xC0000005: Access violation reading location 0x00610061. But the debugger didn t stop! The program didn t crash either. If you hadn t been in the debugger, you would not have gotten any clues that this exception occurred because the program caught and handled the exception. As a tester interested in catching these exceptions, how could you have caught the exception in the debugger?
-
In Microsoft Visual C, on the Debug menu, click Exceptions. The Exceptions dialog box appears.
-
Expand the Win32 Exceptions node.
-
Select c0000005 Access Violation.
-
Choose Break Into The Debugger in the When The Exception Is Thrown box.
-
Dismiss the dialog box, and run the program again.
What happens?
This time the debugger stops. When you [Break], the Disassembly window tells the whole story:
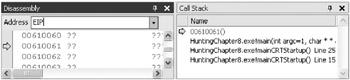
Gee, your data was aaaaaaaa aaaa , and the letter a is 0x0061 in Unicode (UCS-2), so this really looks a lot like your overlong data.
Suppose you want to break at this exception handler but not other exception handlers?
Let s step through and make some observations. Stop the current program first, and then step into the program from the start. You can put a breakpoint on Pizza and run.
Now that you are at the breakpoint, look around a bit. The stack is a good place to start. Look at ESP in memory.
Because you are just inside the function, 0x004010EC is probably the return address. Check in the Disassembly window.
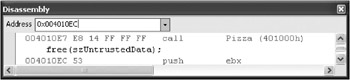
The call to Pizza was made at address 0x004010E7, and the return address will be 0x004010EC. Now that you confirmed the return address, look at the current instruction pointer in the Disassembly window to see what s up ahead.
OK, do you see the exception handler? Step in the debugger until that is on the stack.
Now you can look at the stack again to see where the exception handler is on the stack.
The exception handler is 0x00407150. Find that in the Disassembly window and put a breakpoint on it.
Once the breakpoint is set, you can disable breaking on access violation exceptions and this particular exception will still break in the debugger as long as the breakpoint is set.
The key concepts are these:
-
Just because an exception is handled doesn t mean it s exploitable.
-
Not all overflows appear as crashes.
-
You can turn on exception handling in the debugger to see other overruns.
-
You can find and set a breakpoint on a specific exception handler.
Memory Spikes
Memory spikes are sudden, large allocations of memory. Using a tool that can monitor memory usage can be valuable in finding memory spikes. If you replace a null with 0x00FFFFFF and notice the application trying to allocate a huge amount of memory, it is clear an attacker can directly manipulate how much memory is in use by the program. Although at first glance the bug seems like a denial of service issue, there might be an exploitable overrun of some sort if the memory cannot be allocated, for example. To keep track of how much memory a particular process uses, use the tools discussed in Chapter 14, Denial of Service Attacks.
| Important | When you see an application use up a large amount of resources, your first thought might be performance bug “ but if you were fuzzing or trying long input, the memory consumption might really indicate an exploitable overflow condition. |
Sometimes the bug isn t more than a performance issue, but consider two cases that have security issues:
-
When memory is allocated based on the length the attacker specifies but the success of the memory allocation is not verified before writing.
-
When the attacker can convince the program to allocate less memory than is actually used.
Changes in Behavior
Sometimes an exception handler handles the exception caused by the overflow, or the overflow occurs during a memory reading operation and not a writing operation. Sometimes this is worse than others, but we should take a quick look at an example of one way to find issues when there are no memory spikes or exceptions.
First, assume a client/server application is called serv2 (included on the book s companion Web site). Let s look at all of the interfaces for overflows.
The same code works as both a client and a server. To use as a server, just run serv2.exe. To use as a client, run serv2.exe with the command you want to send to the other client ”it uses a loopback socket to simulate a client/server application on just your test machine.
All we know about the server is that it fetches records, and that it supports commands ? and GET (let s keep it simple). The SDK includes a utility to submit these commands remotely for testing. So let s start up the server. Note that the user input is in bold type. At the command prompt, type serv2.exe as the command:
E:\Chapter8\Code\Serv2\Debug>serv2.exe
| Note | Serv2.exe is both a client and a server. From this point forward, all uses of serv2.exe are as a client. For it to work, another copy of serv2.exe must be running as a server (with no command-line arguments specified). |
The server (serv2.exe with no parameters) sits there waiting for someone to connect and send commands. In a separate command window, start sending commands, such as the following:
E:\Chapter8\Code\Serv2\Debug>serv2.exe "?" GET Record#
The only documented command is the GET command. But try a few others.
E:\Chapter8\Code\Serv2\Debug>serv2.exe "GET 5" Invalid record number.
Maybe they start with a bigger number.
E:\Chapter8\Code\Serv2\Debug>serv2.exe "GET 100" Record number too long.
OK, the application is obviously doing some validation. What, exactly, is a valid record? After playing around with it, you will find that the only input this application seems to take is GET 0 , GET 1 , and GET 2 .
E:\Chapter8\Code\Serv2\Debug>serv2.exe "GET 2" .79 is the value of record 2
You can try letters , other commands, and long input, all to no avail. Time to move on, right? Wrong. Remember how you got the client from the developer? Take a look at what the client is actually sending to the server ”remember that not every client is written using the same assumptions as the server.
To do this, in a network application, you could run a network sniffer (refer to Chapter 3, Finding Entry Points, and Appendix A, Tools of the Trade, for more information) to see what the client and the server send each other. That s a good approach, but here you want to dig more deeply to discover some additional options for breaking things.
Fire up the debugger of choice (use NTSD for now) and put a breakpoint on the send API in Winsock:
E:\Chapter8\Code\Serv2\Debug>ntsd serv2.exe "GET 0"
| Note | NTSD is a console-based application debugger included with the Windows operating system. The latest version is also available at http://www.microsoft.com/whdc/devtools/debugging/default.mspx . |
Once the NTSD window appears, you can set a breakpoint on WS:
0:000> bp WS2_32!send
(Ignore the error saying the debugger could not find symbols.) You can type in the bl (list breakpoints) command to see whether the breakpoint is set properly:
0:000> bl 0 e 71ab428a 0001 (0001) 0:*** WS2_32!send
Now enter the g (go) command. The breakpoint hits, so now you can look at the stack to see what is actually being sent:
0:000> g Breakpoint 0 hit WS2_32!send: 71ab428a 8bff mov edi,edi | Troubleshooting | If you do not hit the breakpoint and you see a connect() failed message, it indicates the serv2 server is not running. To start the serv2 server, in a second console window run another copy of serv2.exe with no command-line parameters and keep it running while you try again. |
Use the d esp command to dump the top of the stack to see the arguments sent to the send API:
0:000> d esp 0012fbb8 a0 1f 41 00 a4 07 00 00-fe 12 38 00 06 00 00 00 ..A.......8..... 0012fbc8 00 00 00 00 00 00 00 00-ec f7 07 00 00 40 fd 7f .............@.. To understand this, you need to look up the declaration for the function send . Fortunately, it is documented on Microsoft Developer Network (MSDN).
int send(SOCKET s, const char* buf, int len, int flags); | Tip | Microsoft provides a lot of technical information about Microsoft technologies on MSDN. To look up information, go to http://msdn.microsoft.com , and then search for a technology or function by name. Other companies provide similar sites for technologies they work with or support. |
Look at the stack (the output from the d esp command). Remember what you learned earlier about the stack? Because this is a 32-bit system, A0 1F 41 00 is probably the return address, although it is stored backward in little endian notation (so the real return address is 0x0041F1A0). The parameters of the send API can be deduced as follows :
-
The A4 07 00 00 is 0x000007A4 and is the socket, corresponding to the SOCKET s parameter of the send API.
-
The FE 12 38 00 is 0x003812FE and is probably a pointer to the buffer sent, corresponding to the const char* buf parameter of the send API.
-
The 06 00 00 00 is 0x00000006 and is the length of the data sent, corresponding to the int len parameter of the send API.
-
The 00 00 00 00 is 0x00000000 and is the int flags portion of the send API.
Dump (output) the memory to see the buffer being sent. As mentioned in the second bullet in the preceding list, you can see that this buffer is located at 0x003812FE:
0:000> d 003812FE 003812fe 47 45 54 20 30 00 fd fd-fd fd ab ab ab ab ab ab GET 0...........
You can see from the first six bytes of the hexadecimal dump that the client serv2.exe is sending 47 45 54 20 30 00 as the buffer. This is the GET 0 command with a trailing null byte. So what happens if you overwrite that byte with 0xFF? You can write your own client or Perl script to send this without a null byte (that might be more practical, especially if you want to retest this case later), but because you are in the debugger, just do it there.
The 0x00 you wish to replace is five bytes past 0x003812FE.
0:000> e (003812FE + 5) 00381303 00 FF 00381304 fd (NOTE: Just press ENTER here). 0:000> d 003812FE 003812fe 47 45 54 20 30 ff fd fd-fd fd ab ab ab ab ab ab GET 0...........
You can edit memory by typing e (003812FE + 5) ; then it will prompt you with 00 and you can type FF to replace the null . When it presents you with fd , simply press Enter to finish. A quick d 003812FE (see earlier) confirms you have made the right changes:
0:000> g Record number too long.
When you go again, you get the familiar response from the server. Maybe instead of replacing the null byte you can make the data length shorter. A quick q command enables you to exit the debugger to try again:
E:\Chapter8\Code\Serv2\Debug>ntsd serv2.exe "GET 0" 0:000> bp WS2_32!send 0:000> g
The debugger quickly hits the breakpoint:
Breakpoint 0 hit
Examine the stack again.
0:000> d esp 0012fbb8 a0 1f 41 00 a4 07 00 00-fe 12 38 00 06 00 00 00 ..A.......8.....
This time, you can try to tweak the length to exclude the null byte because the server complained the input was too long/invalid (the server didn t like the 0xFF, even though that was a good test case).
0:000> e esp+c 0012fbc4 06 05 0012fbc5 00
The length was 6, now it is 5. Figure 8-15 shows what happens when you send this case (press G+Enter). You are able to read other sensitive information from the server because the server assumes the client will send a null-terminated string. There is no way to test this case without crafting custom data on the network.
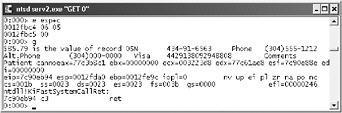
Figure 8-15: Excluding the null byte
Whoa! Notice that? You read a lot of junk out of memory someplace you shouldn t have seen because the server code assumed the client would always send the null . Your testing paid off ”how big might the limit on that credit card be, and what other information can you get from memory (aside from a criminal record)?
It is always worth checking null s and lengths that go over the wire to see what might come back. In this case, you got all the goods, and they all displayed in the application s window (the console here). What if the server sent the goods and the client application just didn t display them? Specifically, what if it worked as follows:
-
Client sends the request with no null terminator.
-
Server has the bug you have found here but returns $85.79 is the value of the record 0[null]N434- to the client.
-
Now, the client has the full information but only displays up to the null in the user interface (UI).
Would you have known there was a bug? How can you really find out what is actually being returned to the client from the server? It can pay huge dividends for you to understand what actually goes over the wire and to test at that level.
Runtime Tools
Fortunately, you won t have to break out the debugger every time you want to test a certain case. A number of runtime tools available can assist your testing efforts.
Bounds Checker
BoundsChecker, available at http://www. compuware .com/products/devpartner/visualc.htm , allows compilation of an instrumented version of the binary and does bounds checking on a particular set of APIs.
Debugger
Keep in mind that the debugger can be very useful at trapping certain types of exceptions. Refer to the section titled Exceptions earlier in this chapter for more information. Note also that Appendix A lists many popular debuggers in addition to those explicitly used in this chapter.
Gflags.exe
The utility called Gflags ships in the \support\tools folder on the installation CDs for Microsoft Windows 2000, Windows XP, and Windows Server 2003 (see http://www.microsoft.com/technet/prodtechnol/windowsserver2003/library/TechRef/b6af1963-3b75-42f2-860f-aff9354aefde.mspx for more details). The Gflags utility enables the tester to manipulate how a given executable is loaded and how the heap is managed.
To use Gflags.exe to test for heap overflows, see the walkthrough Heap overruns and Gflags.exe.
| Heap overruns and Gflags.exe | At the command prompt, type the following command: E:\Chapter8\Code\BuggyApp>gflags.exe -p /enable BuggyApp.exe Run the release build of BuggyApp.exe in the debugger. Figure 8-16 and Figure 8-17show what happens. By adding extra heap checks to the run time, Gflags.exe enables you to find issues more quickly because they throw exceptions rather than silently corrupting the heap. 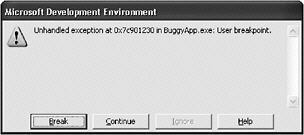 Figure 8-16: An exception thrown 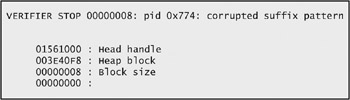 Figure 8-17: Gflags.exe output Look at the debug output, which is shown in Figure 8-17. The figure shows an example of a heap overrun and what can appear in the Gflags.exe output: corrupted suffix pattern means an allocation was written past the end. The suffix pattern is written by the heap manager when the memory is allocated. When the memory is freed, the heap manager checks the pattern and will throw a breakpoint exception if the heap has been overwritten. Look at the code. You can tell which variable is corrupted: the same one being freed. In this case, it is pFoo (see Figure 8-18). You know from what the debugger shows you that the heap variable pFoo is corrupted, but you don t find out until the program calls the free function on the variable. 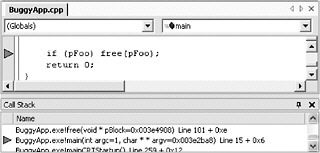 Figure 8-18: The corrupted variable This is a good way to find overrun bugs, but you can catch the problem when the actual overwrite takes place by using Gflags.exe as well: E:\Chapter8\Code\BuggyApp>gflags.exe -i BuggyApp.exe +htc +hfc +hpc Current Registry Settings for BuggyApp.exe executable are: 02000070 htc - Enable heap tail checking hfc - Enable heap free checking hpc - Enable heap parameter checking hpa - Enable page heap Rerun BuggyApp.exe in the debugger. The following graphic shows this dialog box: 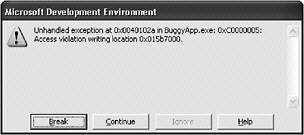 This time, the line of code that attempted the invalid write is very obvious in the debugger: 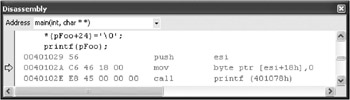 Disable the checks by running the following commands: E:\Chapter8\Code\BuggyApp>gflags.exe -i BuggyApp.exe -htc -hfc -hpc Current Registry Settings for BuggyApp.exe executable are: 02000000 hpa - Enable page heap E:\Chapter8\Code\BuggyApp>gflags.exe -p /disable BuggyApp.exe |
Fuzzing
Remember from Chapter 4, Becoming a Malicious Client, that fuzzing is the act of crafting arbitrary data and using it in testing the application. Fuzzing finds other bugs but is particularly effective at finding overflows.
Although fuzzing can produce a fair amount of success at the outset, some of the requirements for successful longer- term fuzzing include the following:
-
High number of iterations.
-
Fuzzing interesting data while keeping the overall data format intact.
-
Automated ability to determine when there is a read AV, write AV, or other case of interest.
-
Ability to weed out duplicate bugs efficiently .
-
A record of the data that caused the problem for reproducibility . For network requests , this might include more than one transaction.
-
Automated ability to get the application in the correct state, where it applies.
| Important | When fuzzing identifies bugs, don t call it a day and stop “fuzzing is actually pointing out weak areas in the product that warrant further attention through manual testing and code review. Fuzzing can help prioritize which areas are most important to code review. |
EAN: 2147483647
Pages: 156