Using a Debugger to Trace Program Execution and Change its Behavior
After you use monitoring tools to better understand the program, using a debugger takes you one step deeper. Even without access to the source code or symbols, you can still debug an application. Instead of seeing the source code in a high-level language such as C/C++, in a debugger you see the source code represented in assembly language. By using a debugger, you can modify the execution flow of a program to make it perform actions that would not normally occur. You can also read and write the process s memory. Although the ability to modify execution flow under the debugger does not constitute a security flaw, this approach can aid in security testing.
Using a debugger can save you tremendous amounts of time and can also enable you to test cases that defy a program s logic by forcing the application to abandon its normal pattern of flow. For instance, we recently tested a server and a client application that encrypts and signs each packet in a complex way. We wanted to test the server by sending characters that the client software prevents the user from sending. One way we might have accomplished this task could be to craft the data manually, encrypt it, and sign it. However, such work is not trivial. Instead, we used the existing client by running it under a debugger and skipping the character validation that normally occurs. This approach successfully allowed our illegal characters to be encrypted and signed by the client. The server gladly accepted the data it received because the data was correctly encrypted and signed. We were able to exploit the server because the server logic assumed it was not possible for the client to send these illegal characters and did not validate the data itself. By using this approach, we were able to save several days of testing.
| Tip | Debug output is sometimes used by developers to help them better understand the state the application is in without stepping through each line of code. If code that ships to the public contains debug output using an API such as OutputDebugString , attackers can use this data to more easily understand the logic of the program. Also, anyone who attaches a debugger to the running program is able to see the output. Although an attacker could step through the binary s assembly code to gain information similar to that normally contained in debug output, using debug output takes less time and expertise. |
Modifying Execution Flow to Bypass Restrictions
Software vendors often impose restrictions on what users can do with a particular piece of software or how the program can be used, sometimes by introducing checks to prevent anyone from modifying execution flow. Some checks include digitally signing the binary and then verifying the signature, checking to see whether a debugger is attached, and obfuscating the binary. Although these measures slow the inspection and testing process, they do not prevent it from a technical point of view. With a little knowledge of assembly and a debugger, it is possible bypass these restrictions. In some cases, such as software designed to protect against unauthorized copying, bypassing such restrictions may enable use of the program without purchasing a license and could result in a loss of revenue for the software vendor. It is important, therefore, that the vendor identify any such vulnerabilities to ensure the robustness of the protection scheme. The techniques used to defeat copy restrictions can also be used to modify an existing client or server so that it is able to send data not normally allowed. Sending this data might enable you to find a security bug in the software that receives the data, as discussed in Chapter 4 and Chapter 5, Becoming a Malicious Server.
One approach to modifying the execution flow is to use a debugger and manually modify instructions at run time. This approach works, but can become time-consuming if the same modifications need to be made repeatedly. Patching the program s binary enables you to remove certain restrictions from the software permanently.
Patching Binaries
When the source code is not available, it is possible to patch binaries to fix bugs in code, to make small functionality changes to better suit the user s needs, or to remove restrictions built into the software. A common type of restriction built into software is copy protection. It is important that a software vendor test the robustness of its copy protection schemes to minimize the ease with which they will be bypassed by unauthorized users. Typical copy protection schemes might include a requirement that users register the product before use, time restrictions (beta and trial software often do this), and permitting the product to run only in a reduced-functionality mode until the user registers (shareware commonly does this). The following example shows one way that a copy protection check might be removed from a binary or bypassed. The same approach might be taken to effectively remove other restrictions.
Example: Challenging the Robustness of a Copy Protection Check from a Binary
Copy protection schemes often involve a process in which the software checks whether it should run and, if it should, which functionality should be exposed. One type of copy protection, common in trial software, allows a program to run only until a certain date. If you can modify the binary file on disk or in memory, you can modify that part of the program s code or remove it completely.
To follow along with this example, you need the following:
-
Expiration.exe Included on this book s companion Web site
-
OllyDbg Shareware debugger/disassembler with great patching and reverse engineering features; available at http://www.ollydbg.de/
When you attempt to run Expiration.exe, it will refuse to load because the current date is past the date on which the authorized trial expired . How can you use this program regardless of the expiration of the trial period? One approach is to set your computer s clock back so that the program believes today s date is within the trial period. But this isn t a very elegant solution, and resetting your system date might cause issues for other programs you are running. However, by patching the binary, the copy protection checks that prevent the program from running after the trial period ends can be removed, and the program can be used without having to set your computer s clock back. One common approach to finding and neutralizing the time limit code is as follows :
-
Run the program to understand what happens when the trial period has expired.
-
Once the program refuses to load normally, break into the debugger.
-
Trace the code backward to identify the code path (s) that led to the error indicating that the trial period has expired.
-
Modify the binary to force all code paths to succeed and to never hit the trial expiration code path.
-
Test the modifications.
Step 1: Understanding what happens when the trial has expired This step is simple enough. Run Expiration.exe. Upon loading Expiration.exe, you are greeted with the dialog box shown in Figure 17-3, which says, Sorry, this trial software has expired. To continue to use this software, please purchase a full copy.
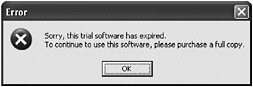
Figure 17-3: Error message in Expiration.exe that warns the software cannot be used because the trial period has expired
Step 2: Breaking into the debugger once the error code path has been executed The person who wrote this program has provided you with a very helpful error message indicating when the trial period has expired. You can use this error message to help identify any code that might lead to the error code path. While the error dialog box is still displayed, start debugging this process using OllyDbg.
To debug the Expiration.exe process that is already running, open OllyDbg, and on the File menu select Attach. In the dialog box that is displayed, you can select the process you wish to debug. Select Expiration.exe, and then click the Attach button.
After attaching to the process in OllyDbg, press F9 to continue execution of Expiration.exe. Now you re ready to find the time limit code.
Step 3: Tracing backward to identify the time limit code Next , find the code that causes the error message to be displayed. Inside OllyDbg, press F12. This pauses the process and enables you to debug it.
-
Finding where the error message was displayed View the call stack by pressing Alt+K. The call stack is displayed as shown in Figure 17-4. Notice that OllyDbg shows that the trial error text is a parameter to MessageBoxA . Select USER32.MessageBoxA near the bottom of the call stack. Right-click in the call stack window, and choose Show Call. The CPU window in which the assembly call to MessageBoxA is selected is displayed. This is a starting point for beginning the backward trace to identify where the time limit check was performed.
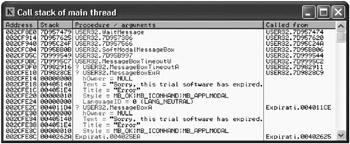
Figure 17-4: Viewing the Expiration.exe call stack, which quickly reveals that MessageBoxA is used to display the error message -
Using OllyDbg features to help analyze the code OllyDbg has a nice Analyze Code feature that enables you more easily to follow the assembly code called. Press Ctrl+A to have OllyDbg analyze Expiration.exe. The CPU window will look similar to the one shown in Figure 17-5. Notice that there are greater than signs (>) next to some of the lines of code. If a line of code begins with a greater than sign, another line of code jumps to that location.
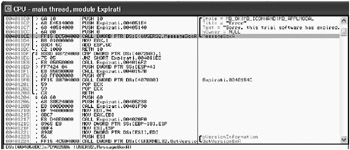
Figure 17-5: CPU window showing the call to MessageBoxA as the cause of the display of the expiration error dialog boxDirectly before the call to MessageBoxA , four parameters are pushed onto the stack. The PUSH 10 instruction contains a greater than sign before it, so you know it is referenced by another line of code. Select this line of code containing PUSH 10.
Tip The line of code directly before the PUSH 10 line is a RETN instruction, which is used to return to an address. The line of code after the RETN instruction will not be executed after RETN is executed. This means that there are only two code paths to get to the MessageBoxA call that displays the error message ( 0x00401055 and 0x00401063 ).
-
Finding what caused the error message to be displayed When you select the PUSH 10 instruction located at 0x004011C0, the lines of code that reference the selected line are displayed in the text area below the top pane in the CPU window. You should see Jumps For 00401055, 00401063 displayed. Right-click in this text area to open the shortcut menu shown in Figure 17-6 that includes options to go to each location that references PUSH 10 .
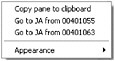
Figure 17-6: An OllyDbg shortcut menu that allows you to navigate easily to code that refers to a selected line of code
Step 4: Modifying the binary to never hit the expiration code path The context menu shows that both 0x00401055 and 0x00401063 contain JA s to the PUSH 10 used for MessageBoxA . JA (jump above) is a conditional statement instruction meaning jump if above. It often follows a CMP instruction (used to compare two operands). In this case, the JA is used to jump if the current date is later than (above) the date the trial expires .
Select Go To JA From 00401055 . You should now be on code at location 0x00401055. You want to prevent the program from hitting the error code path. One way to do this is by changing the JA instruction to an NOP (which stands for no operation and is an instruction that tells the processor to do nothing). This effectively wipes out the JA code path to the expiration code path.
Right-click inside the CPU window, click Binary, and then click Fill With NOPs. You should see the code in the CPU window change from a JA to a series of NOP s. Another common approach you can use when patching binaries is to reverse the logic so the opposite decision is made. For example, a JE (jump equal) is replaced with a JNE (jump not equal), or JA is replaced with JBE (jump below or equal).
-
Repeat the steps to modify the other jump. Press the hyphen key (-) to go back to the PUSH 10 instruction. Using the same steps you used to replace the JA at 0x00401055 with NOP s, replace the JA at 0x00401063 with NOP s.
-
Save the modifications. Save the modifications by right-clicking in the CPU window, clicking Copy To Executable, and then clicking All Modifications. Select Copy All in the dialog box that is displayed. A new window will appear named Expiration.exe. Right-click in this window, and choose Save File. Save the file as Expiration-cracked.exe.
Step 5: Testing the modifications Now load the modified program (Expiration-cracked.exe). Congratulations! You ve successfully defeated the expiration trial period mechanism. You should see the dialog box shown in Figure 17-7.
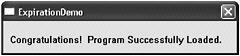
Figure 17-7: Successful patching of the binary, which allows the Expiration program to load regardless of the date
This example demonstrates one way to challenge the strength of your copy protection measures and identify ways to make your software more secure against unauthorized use. Can you think of a way to make overcoming this protection example more difficult? One way would be to have the expiration decision made in a thread separate from the one that displays the error dialog. Tracing the code backward as we did in this example would then be more difficult.
Creating uncrackable copy protection is impossible . However, creating copy protection that is reasonably robust and prevents quick cracking is an achievable goal. By attempting to defeat the copy protection of your application, you can learn a great deal about how robust the protection scheme is. By doing this testing before the product becomes publicly available, you can change the code to make circumvention of the copy protection scheme more difficult before it is released.
Reading and Modifying Memory Contents Under a Debugger
Just as the execution flow can be observed and modified under a debugger, so can the contents of memory. By using a debugger, you have full access to all of the process s memory contents. In addition to being able to enter data that would not normally be allowed through the application, you are able to see data that the programmer might not want you to see. For example, some programmers store passwords and other secrets in the program s binary. Sometimes these passwords or other secret data are constructed in memory at run time and are not easily visible in the binary file. By accessing memory after the program is loaded, you have access to those secrets.
Copy protection is not limited to protecting software programs from being copied . Electronic documents, media files, and other electronic content formats sometimes use Digital Rights Management (DRM) to allow access only to certain users or to otherwise limit their reproduction or use. If you can view (or play, in the case of media files) the content on your computer, the content likely is present in memory at some point. If this is the case, it may be possible to defeat the copy protection and obtain access to the content regardless of limitations normally imposed by the software viewer or player.
By using a debugger, you have access to a process s memory. OllyDbg enables the user to search, copy, and edit the contents of a process s memory. This is useful in itself, but it is sometimes helpful to set breakpoints when a memory location is accessed. This technique can help you better understand how attacker-supplied data is used once it is in memory. The following example demonstrates how to set breakpoints on memory reads and writes .
| Tip | WinHex ( http://www.winhex.com ) is a hex editor that contains many features, one of which is searching and modifying data in RAM. This tool makes accessing memory extremely easy without using a debugger. |
Example: Setting a Breakpoint on Memory to Understand How User Input Is Used
Programs sometimes require a name /serial code combination to register the software. Failure to register the program can result in the program not running or running in a reduced-functionality mode. When users pay for a program, they are given a serial code and are asked to enter it into the program to bypass the restrictions imposed on unregistered software. If the user enters a valid serial code, the program is unlocked and restrictions associated with an unregistered copy are bypassed.
Often the serial code corresponds in some way to the name of the person registering the program. Software vendors do this as a precaution against software piracy. Paying customers might post their serial codes to the Internet in an effort to share the program illegally, but the serial code alone does not allow other users to register their copies of the software. Under this scheme, both the user s name and the serial code are required. Software vendors gamble that users won t post both their names and serial codes to the Internet for sharing, for fear of legal action by the vendor.
Take a look at Crackme1.exe, which is included on this book s companion Web site. When users enter their name and serial code (see Figure 17-8), the program decides whether the serial code is correct. The program must have some algorithm to determine the correct serial code for the name entered. Think about how a program like this might be implemented. One way a programmer might verify the serial code is to generate the correct serial code for the name entered, and then compare the generated serial code to the one entered. If you can see the data in memory that is compared to the invalid serial code you entered, you could easily copy the valid serial code from the process s memory and successfully register on your next attempt. Note that not all validation routines generate the full serial number to compare to the one entered; instead, pieces of the entered serial code are validated separately.
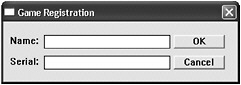
Figure 17-8: Registering software by entering a name and serial code
| Tip | This example shows a quick way to better understand how data you enter is used by an application. Among those who break registration schemes, obtaining the serial code from memory is considered a beginner s technique. A more elegant approach is to disassemble the registration validation scheme, study the disassembly to learn its internal workings, and create a separate program that generates a valid key given an arbitrary name. Understanding the disassembly to this level requires more skill and is discussed later in this chapter. The approach of patching the binary is sometimes also used to defeat registration routines. However, patching the binary can introduce bugs and result in unexpected behavior. Reserve patching for places where no other alternative is available. |
Now imagine that you want to find the secret serial code in memory. In particular, imagine that you want to find the part of the program that compares the invalid serial code you entered with the valid one generated by the program. How can you do that? You could start by disassembling the program, studying the disassembly to gain a thorough understanding of the code, and then setting a breakpoint on the compare. But this is time-consuming. A faster alternative is to set breakpoints on APIs that might read your data into memory, and then set a memory access breakpoint on the memory address containing your data. This way, whenever a part of the program attempts to access your data, the debugger will pinpoint that part of the program for your examination.
Step 1: Setting breakpoints on APIs the binary uses to obtain your data The user data comes from text boxes in the user interface (UI), like the one shown in Figure 17-8. On the Microsoft Windows platform, a few common APIs retrieve text from a text box. One of the most common is GetDlgItemText . Like many Windows APIs, two versions of this API are available: ASCII and wide (Unicode). It is helpful to set breakpoints on both versions of APIs so one isn t missed. After you open Crackme1.exe in OllyDbg, you can set a breakpoint on these APIs by using the command line. Open the Command Line window by pressing Alt+F1, and then enter the commands bpx GetDlgItemTextA and bpx GetDlgItemTextW (appending an A or a W specifies which version of the API is targeted ). Press Enter after each command, as shown in Figure 17-9, to display the Intermodular Calls window with breakpoints set for the specified API. Feel free to close this window.
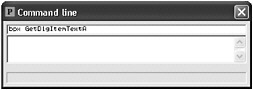
Figure 17-9: Setting breakpoints on APIs in the Command Line window
| Tip | Microsoft Developer Network (MSDN) at http://msdn.microsoft.com provides a great reference for Windows APIs. Use this resource to understand where to set breakpoints and what the APIs do. |
Step 2: Running the program to hit the breakpoint Now that your breakpoints are set, run the program under the debugger by pressing F9. Enter your name as MyName and serial code as serial , and then click OK. You should now be back in the debugger because you hit a breakpoint.
Step 3: Determining whether this breakpoint reads the data of interest As discussed in Chapter 8, if a function requires parameters, those are pushed onto the stack directly before the call to that function. Scroll up in the CPU window and you ll see the parameters used to call GetDlgItemTextA . OllyDbg is smart enough to match the names of the API parameters to the PUSH operations that happen in assembly. As shown in Figure 17-10, it is easy to determine which parameter is named buffer . In this example, buffer is the memory referenced by the EDX register.
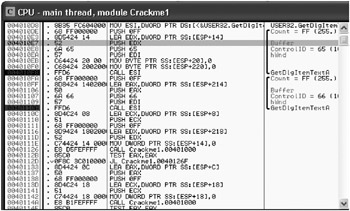
Figure 17-10: Parameter names automatically matched up with PUSH operations in OllyDbg
Now you need to determine whether this buffer gets the data of interest (the serial code). Click in the dump portion of the CPU window (which is directly beneath the disassembly), press Ctrl+G, and then type EDX into the dialog box. This displays the contents of the memory location that EDX references. You can step over the call to GetDlgItemTextA by pressing F8, and then inspect this memory location.
As it turns out, the memory is populated with the name you enter. That s not what you re looking for, so press F9 to continue running the program. You ll immediately jump back into the debugger. Follow the same steps (hit breakpoint, press Ctrl+G for the register pushed onto the stack for buffer , press F8 to step over the call, and inspect the memory location) to determine whether serial is copied to memory. The second time through, you should see this happen. Now you ve found the memory of interest ”time to set a breakpoint on it.
Step 4: Setting a breakpoint on memory Strings are typically accessed by their first character. You can set a breakpoint on this memory location by selecting the s in serial displayed in the dump pane (directly below the disassembly pane), right-clicking in the pane, clicking Breakpoint, and then clicking Memory, On Access, as shown in Figure 17-11.
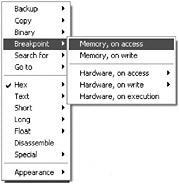
Figure 17-11: Setting a breakpoint on a memory location to allow easy runtime discovery of any code that accesses that memory
Step 5: Watching what happens when memory is accessed Press F9 to continue to run Crackme1.exe. You ll again hit a breakpoint. This time it is the breakpoint on memory you just set. The line of code that accessed the memory is the following:
CMP BYTE PTR DS:[ESI],0
This is a comparison operation that compares the memory ESI is pointing to (the serial code entered) to 0. This isn t very interesting. This is a check to see if the serial code is null. Press F9 to continue running Crackme1.exe.
You ll hit another memory breakpoint, but this time on the following line of code:
REPNE SCAS BYTE PTR ES:[EDI]
This instruction is used to determine the length of the string at the location pointed to by EDI . ( EDI is now pointing to serial .) That s not what you want. Press F9 again.
Another breakpoint, this time on the following code:
REPE CMPS BYTE PTR ES:[EDI],BYTE PTR DS:[ESI]
This is a compare! The instruction compares two strings ”the strings at ESI and EDI . Take a look at each of these locations as discussed in step 3, but this time use the locations of ESI and EDI instead of EDX . Notice anything interesting? Yes, serial is compared to yMaNem . Could this string be the valid serial code? Try to register again and find out. yMaNem is a pretty weak serial code, but regardless of how complex a serial code is, you can obtain it using the technique described here if the serial code you enter is compared to the correct code.
EAN: 2147483647
Pages: 156