4. Audio-Centric Summarization
4. Audio-Centric Summarization
In this section, we present an audio-centric summarization system that creates a motion video summary of the input video by selecting video segments that contain semantically important speeches. This summarization system is especially effective for summarizing video programs that record meetings, report news events, disseminate knowledge, such as news reports, documentaries, conference/seminar videos, etc.
4.1 System Overview
Figure 10.1 shows the block diagram of the audio-centric summarization system. For the audio track of the input video, speech recognition is first conducted to obtain a speech transcript that includes the recognized sentences along with their time codes within the audio track (Module 1). Next, a text summarization method (described in Section 4.2) is applied to the speech transcript to obtain an importance rank for each of the sentences in the transcript (Module 2). An audio-centric summary is created by selecting the video segments of the sentences in descending order of their importance ranks (until the user specified summary length is reached), and then concatenating the selected video segments in their original time order (Module 3). Because each sentence in the speech transcript has a time code indicating its start and end positions in the original video sequence, the video segment containing a particular sentence can be easily determined using the time codes.
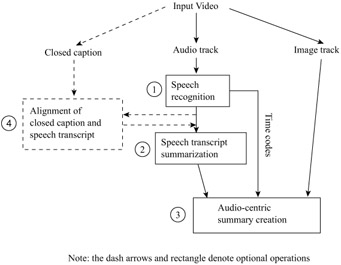
Figure 10.1: Block diagram of the audio-centric summarization system.
If closed captions for the original video are available, they will be utilized to reduce errors in the speech transcript generated by the speech recognition engine (Module 4). In fact, closed captions often contain many errors such as typing mistakes, the dropping of certain words/phrases, etc. because they are usually generated by human operators during the live broadcast of a video program. Nonetheless, by aligning the speech transcript with the corresponding closed captions, and then taking as many grammatically correct segments as possible, we are able to improve the correctness of the speech transcript by a large percentage.
Obviously, the text summarization module (module 2) is the centerpiece of the whole audio-centric summarization system, and the eventual summarization quality of the system is solely determined by the performance of this module. In the following subsections, we present two text summarization methods developed by us, and describe their systematic performance evaluations in detail.
4.2 Text Summarization
A document usually consists of several topics. Some topics are described intensively by many sentences, and hence form the major content of the document. Other topics may be just briefly mentioned to supplement the major topics, or to make the story more complete. A good text summary should cover the major topics of the document as much as possible, and at the same time keep redundancy to a minimum.
In this section, we present two methods that create text summaries by selecting sentences based on the relevance measure and the latent semantic analysis. Both the methods need to first decompose the document into individual sentences, and to create the weighted term-frequency vector for each of the sentences. Let Ti = [t1i,t2i, ,tni]t be the term-frequency vector of passage i, where element tji denotes the frequency in which term j occurs in passage i. Here passage i could be a phrase, a sentence, a paragraph of the document, or could be the whole document itself. The weighted term-frequency vector Ai = [a1i, a2i, , ani]t of passage i is defined as:
| (10.1) |
where L(tji) is the local weighting for term j in passage i, and G(tji) is the global weighting for term j. When the weighted term-frequency vector Ai is created, we have the further choice of using Ai with its original form, or normalizing it by its length | Ai |. There are many possible weighting schemes. In Section 4.3.3, we inspect several major weighting schemes and discuss how these weighting schemes affect the summarization performances.
4.2.1 Summarization by Relevance Measure
After the document has been decomposed into individual sentences, we compute the relevance score of each sentence against the whole document. We then select the sentence k with the highest relevance score, and add it to the summary. Once the sentence k has been added to the summary, it is eliminated from the candidate sentence set, and all the terms contained in k are eliminated from the original document. For the remaining sentences, we repeat the steps of relevance measure, sentence selection, and term elimination until the number of selected sentences has reached the predefined value. The operation flow is as follows:
-
Decompose the document into individual sentences, and use these sentences to form the candidate sentence set S.
-
Create the weighted term-frequency vector Ai for each sentence i ∊ S , and the weighted term-frequency vector D for the whole document.
-
For each sentence i ∊ S, compute the relevance score between Ai and D, which is the inner product between Ai and D.
-
Select sentence k that has the highest relevance score, and add it to the summary.
-
Delete k from S, and eliminate all the terms contained in k from the document. Re-compute the weighted term-frequency vector D for the document.
-
If the number of sentences in the summary reaches a predefined number, terminate the operation; otherwise, go to Step 3.
In Step 4 of the above operations, the sentence k that has the highest relevance score with the document is the one that best represents the major content of the document. Selecting sentences based on their relevance scores ensures that the summary covers the major topics of the document. On the other hand, eliminating all the terms contained in k from the document in Step 5 ensures that the subsequent sentence selection will pick the sentences with the minimum overlap with k. This leads to the creation of a summary that contains little redundancy.
4.2.2 Summarization by Latent Semantic Analysis
Inspired by the latent semantic indexing, we applied singular value decomposition (SVD) to the task of text summarization. The process starts with the creation of a terms-by-sentences matrix A = [A1, A2, , An] with each column vector Ai representing the weighted term-frequency vector of sentence i in the document under consideration. If there are a total of m terms and n sentences in the document, then we will have an m n matrix A for the document. Since every word does not normally appear in each sentence, the matrix A is usually sparse.
Given an m n matrix A, where without loss of generality m ≥ n, the SVD of A is defined as [11]:
| (10.2) |
where U = [uij] is an m n column-orthonormal matrix whose columns are called left singular vectors; ∑ = diag(σ1, σ2, ,σn) is an n n diagonal matrix whose diagonal elements are non-negative singular values sorted in descending order; and V = [vij] is an n n orthonormal matrix whose columns are called right singular vectors. If rank(A) = r, then ∑ satisfies
| (10.3) |
The interpretation of applying the SVD to the terms-by-sentences matrix A can be made from two different viewpoints. From the transformation point of view, the SVD derives a mapping between the m-dimensional space spanned by the weighted term-frequency vectors and the r-dimensional singular vector space with all of its axes being linearly independent. This mapping projects each column vector Ai in matrix A, which represents the weighted term-frequency vector of sentence i, to column vector Ψi = [vil,vi2, ⋯ ,vir]t of matrix Vt, and maps each row vector j in matrix A, which tells the occurrence count of the term j in each of the documents, to row vector Φj = [uj1,uj2,⋯,ujr] of matrix U. Here each element vix of Ψi, ujy of Φj is called the index with the ith, jth singular vectors, respectively.
From the semantic point of view, the SVD derives the latent semantic structure from the document represented by matrix A [12]. This operation reflects a breakdown of the original document into r linearly-independent base vectors or concepts. A unique SVD feature which is lacking in conventional IR technologies is that the SVD is capable of capturing and modelling the interrelationships among terms so that it can semantically cluster terms and sentences. Consider an extreme document with the following terms-by-sentences matrix:
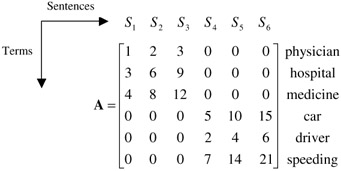
The document consists of only six words and six sentences. Sentences 1 to 3 consist of only the words physician, hospital, and medicine; sentences 4 to 6 consist of only the words car, driver, and speeding. Obviously, the whole document consists of only two topics: Sentences 1 to 3 represent the first topic, which is about hospitals, and sentences 4 to 6 represent the second topic, which is about drivers. Because topic 2 has higher term frequencies than topic 1, it can be considered more important than topic 1. With topic 1, because sentence 3 has the highest term frequencies, it can be considered to best cover the topic. Similarly, sentence 6 can be considered to best cover topic 2.
By performing SVD on the above terms-by-sentences matrix A, we get a projection in the singular vector space shown in Figure 10.2.
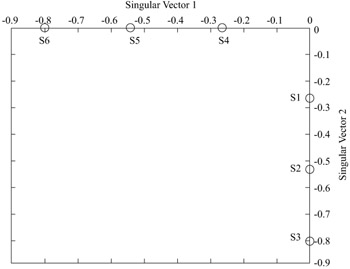
Figure 10.2: The projection of the above terms-by-sentences matrix A into the singular vector space.
Amazingly, sentences 4 to 6 all lie on the first singular vector, and sentences 1 to 3 all on the second singular vector. The singular vectors are sorted in descending order of their corresponding singular values (e.g., the singular value of the first singular vector is larger than that of the second singular vector). On the two axes, sentences with the highest term frequencies have the highest index values. This extreme example strongly supports the hypotheses that
-
Each singular vector from the SVD represents a salient concept/topic of the document.
-
The magnitude of the corresponding singular value of a singular vector represents the degree of importance of the salient concept/topic.
-
The sentence having the largest index value with a singular vector Xi is the one that best covers the topic represented by Xi.
Based on the above discussion, we present the following SVD-based document summarization method.
-
Decompose the document D into individual sentences, and use these sentences to form the candidate sentence set S, and set k = 1.
-
Construct the terms-by-sentences matrix A for the document D.
-
Perform the SVD on A to obtain the singular value matrix ∑, and the right singular vector matrix Vt. In the singular vector space, each sentence i is represented by the column vector Ψi = [vi1,vi2, ⋯,vir]t of Vt.
-
Select the kth right singular vector from matrix Vt.
-
Select the sentence which has the largest index value with the kth right singular vector, and include it in the summary.
-
If k reaches the predefined number, terminate the operation; otherwise, increment k by one, and go to Step 4.
In Step 5 of the above operation, finding the sentence that has the largest index value with the kth right singular vector is equivalent to finding the column vector Ψi whose kth element vik is the largest. By the hypothesis, this operation is equivalent to finding the sentence describing the salient concept/topic represented by the kth singular vector. Since the singular vectors are sorted in descending order of their corresponding singular values, the kth singular vector represents the kth most important concept/topic. Because all the singular vectors are independent of each other, the sentences selected by this method contain minimum redundancy.
4.3 Performance Evaluation
In this section, we describe the data corpus constructed for performance evaluations, present various evaluation results, and make in-depth observations on some aspects of the evaluation outcomes.
4.3.1 Data Corpus
Our evaluations on the two text summarization methods have been conducted using a database of two months of the CNN Worldview news program. Excluding commercial advertisements, one day broadcast of the CNN Worldview program lasts for about 22 minutes, and consists of 15 individual news stories on average. The evaluation database consists of the closed captions of 549 news stories whose lengths are in the range of 3 to 105 sentences. As summarizing short articles does not make much sense in real applications, for our evaluations we eliminated all the short stories with less than ten sentences, resulting in 243 documents.
Table 10.1 provides the particulars of the evaluation database. Three independent human evaluators were employed to conduct manual summarization of the 243 documents contained in the evaluation database. For each document, each evaluator was requested to select exactly five sentences which he/she deemed the most important for summarizing the story.
| Document Attributes | Values |
|---|---|
| Number of documents | 549 |
| Number of documents with more than 10 sentences | 243 |
| Average sentences/document | 21 |
| Minimum sentences/documents | 3 |
| Maximum sentences/documents | 105 |
Because of the disparities in the evaluators' sentence selections, each document can have between 5 to 15 sentences selected by at least one of the evaluators. Table 10.2 shows the statistics of the manual summarization results. As evidenced by the table, the disagreements among the three evaluators are much more than expected: each document has an average of 9.0 sentences selected by at least one evaluator, and among these 9.0 selected sentences, only 1.2 sentences receive a unanimous vote from all three evaluators. Even when the sentence selection is determined by a majority vote, we still get a lower than expected overlapping rate: an average of 2.5 sentences per document. These statistics suggest that for many documents in the database, the manual summarization determined by a majority vote could be very short (2.5 sentence per document), and this summary length is below the best fixed summary length (three to five sentences) suggested in [13]. For this reason, we decided to evaluate our two summarization methods using each of the three manual summarization results, as well as the combined result determined by a majority vote.
| Summarization Attributes | Values | Average sentences/doc |
|---|---|---|
| Total number of sentences | 7053 | 29.0 |
| Sentences selected by 1 person | 1283 | 5.3 |
| Sentences selected by 2 person | 604 | 2.5 |
| Sentences selected by 3 persons | 290 | 1.2 |
| Total number of selected sentences | 2177 | 9.0 |
4.3.2 Performance Evaluation
We used the recall (R), precision (P), along with F to measure the performances of the two summarization methods. Let Sman and Ssum be the set of sentences selected by the human evaluator(s), and the summarizer, respectively. The standard definitions of R, P, and F are defined as follows:
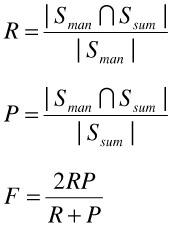
For our evaluations, we set the length of the machine generated text summaries to the length of the corresponding manual summaries. When the evaluation is performed using each individual manual summarization result, both | Sman | and | S sum | are equal to five. When the evaluation is performed using the combined result determined by a majority vote, | Sman | becomes variable, and | Ssum | is set to the value of | Sman |.
The evaluation results are shown in Table 10.3. These results are generated using the weighting scheme that uses binary local weighting, no global weighting, nor normalization (denoted in short as BNN, see Section 4.3.3 for a detailed description). As evidenced by the results, despite the very different approaches taken by the two summarizers, their performance measures are quite compatible. This fact suggests that the two approaches may interpret each other. The first summarizer (the one using the relevance measure) takes the sentence that has the highest relevance score with the document as the most important sentence, while the second summarizer (the one based on the latent semantic analysis) identifies the most important sentence as the one that has the largest index value with the most important singular vector. On the other hand, the first summarizer eliminates redundancies by removing all the terms contained in the selected sentences from the original document, while the second summarizer suppresses redundancies by using the kth singular vector for the kth round of sentence selection. The first method is straightforward, and it is relatively easy for us to give it a semantic interpretation. In the second method, there has been much debate about the meaning of the singular vectors when a collection of text (which could be sentences, paragraphs, documents, etc.) are projected into the singular vector space. Surprisingly, the two different methods create very similar summaries. This mutual resemblance enhances the belief that each important singular vector does capture a major topic/concept of a document, and two different singular vectors do capture two semantically independent topics/concepts that have the minimum overlap.
| Test Data | First Summarizer | Second Summarizer | ||||
|---|---|---|---|---|---|---|
| R | P | F | R | P | F | |
| Assessor 1 | 0.57 | 0.60 | 0.58 | 0.60 | 0.62 | 0.61 |
| Assessor 2 | 0.48 | 0.52 | 0.50 | 0.49 | 0.53 | 0.51 |
| Assessor 3 | 0.55 | 0.68 | 0.61 | 0.55 | 0.68 | 0.61 |
| Majority vote | 0.52 | 0.59 | 0.55 | 0.53 | 0.61 | 0.57 |
4.3.3 Weighting Schemes
In our performance evaluations, we studied the influence of different weighting schemes on summarization performances as well. As shown by Equation (1), given a term i, its weighting scheme is defined by two parts: the local weighting L(i) and the global weighting G(i). Local weighting L(i) has the following four possible alternatives:
-
No weight: L(i) = tf (i) where tf (i) is the number of times term i occurs in the sentence.
-
Binary weight: L(i) = 1 if term i appears at least once in the sentence; otherwise, L(i) = 0.
-
Augmented weight: L(i) = 0.5+0.5
 where tf (max) is the frequency of the most frequently occurring term in the sentence.
 -
Logarithmic weight: L(i) = log(1 + tf (i)).
Possible global weighting G(i) can be:
-
No weight: G(i) = 1 for any term i.
-
Inverse document frequency: G(i) = log(N/n(i)) where N is the total number of sentences in the document, and n(i) is the number of sentences that contain term i.
When the weighted term-frequency vector Ak of a sentence k is created using one of the above local and global weighting schemes, we further have the choice of:
-
Normalization: which normalizes Ak by its length | Ak |.
-
No normalization: which uses Ak in its original form.
Therefore, for creating vector Ak of sentence k, we have a total of 4 2 2 = 16 combinations of the possible weighting schemes. In our experimental evaluations, we have studied nine common weighting schemes, and their performances are shown in Figure 10.3. As seen from the figure, summarizer 1 is less sensitive than summarizer 2 to the changes of weighting schemes. Any of the three local weighting schemes (i.e., Binary, Augmented, logarithm) produces quite similar performance readings. Adding a global weighing and/or the vector normalization deteriorates the performance of summarizer 1 by 2 to 3% in average. In contrast, summarizer 2 reaches the best performance with the binary local weighting, no global weighing, and no normalization for most of the cases, while its performance drops a bit by adding the global weighing, and deteriorates dramatically by adding the normalization into the formula.
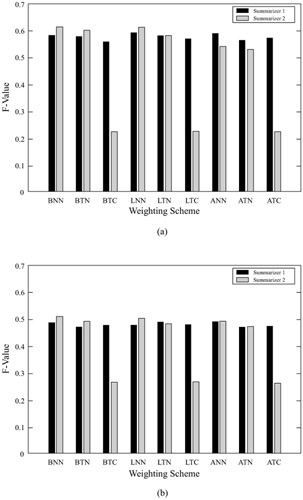
Figure 10.3: The influence of different weighting schemes on the summarization performances. (a),(b),(c),(d)— Evaluation using the manual summarization result from evaluator 1, 2, 3, and the one determined by a majority vote, respectively. The notation of weighting schemes is the same as the one from the SMART system. Each weighting scheme is denoted by three letters. The first, second, and third letters represent the local weighting, the global weighing, and the vector normalization, respectively. The meaning of the letters are as follows— N— No weight, B— Binary, L— Logarithm, A— Augmented, T— Inverse document frequency, C— Vector normalization.
4.3.4 Further Observations
Generic text summarization and its evaluation are very challenging. Because no queries or topics are provided to the summarization system, summarization outputs and performance judgments tend to lack consensus. In our experiments, we have seen a large degree of disparities in the sentence selections among the three independent evaluators, resulting in lower than expected scores (F=0.55 for summarizer 1, F=0.57 for summarizer 2) from the performance evaluation by a majority vote.
It is observed from Table 10.3 that the two text summarizers both receive better scores when they are evaluated using the manual summarization results from evaluator 1 and 3. However, when evaluated using evaluator 2's results, the performance scores drop by 10% in average, dramatically dragging down the performance scores for the evaluation by a majority vote. An in-depth analysis of the cause of this large difference has revealed different manual summarization patterns among the three evaluators. Consider the following passage taken from a CNN news story reporting the recent Israeli-Palestinian conflicts, political efforts for restoring the calm in the region, and hostile sentiments among Palestinian people:
......IN RECENT VIOLENCE MORE THAN 90 PEOPLE HAVE BEEN KILLED, THOUSANDS MORE INJURED, THE OVERWHELMING MAJORITY OF THOSE ARE PALESTINIANS.
......
NOW AFTER A BRIEF LULL IN THE VIOLENCE, NEW FIGHTING, NEW CLASHES ERUPTED THURSDAY, AND TONIGHT MORE GUNFIRE REPORTED WITH MORE INJURIES OF PALESTINIANS.
......
IN THE NORTHERN WEST BANK TOWN NABLUS, ISRAELI TANKS EXCHANGED FIRE WITH PALESTINIAN GUNMEN, KILLED AT LEAST 3 OF THEM ON WEDNESDAY.
The above three sentences all cover the topic of Israeli-Palestinian conflicts. Our two summarizers both selected sentence (1), and discarded (2) and (3) because of their similarities to sentence (1). On the other hand, both evaluators 1 and 3 selected sentence (1), while evaluator 2 picked all the three sentences for summarizing the topic. This example represents a typical pattern that happens repeatedly in the whole evaluation process. The fact suggested by this phenomenon is that, to summarize a document, some people strive to select sentences that maximize the coverage of the document's main content, while others tend to first determine the most important topic of the document, and then collect only the sentences that are relevant to this topic. Evidently, when it comes to the evaluation of our two text summarization methods, the former type of evaluators generates a higher accuracy score than the latter.
EAN: 2147483647
Pages: 393