NVIDIA SHADER DEBUGGER
|
|
The Shader Debugger from NVIDIA is almost reason enough to buy an NVIDIA card. Having interactive debugging capability is something that you really need if you're serious about shader writing. The most interesting thing about the debugger is that it attaches itself to a process and intercepts calls to the hardware—this means that you can view any program that uses shaders and see how the effects are being done.[5]
Figure 6.3 shows that the Shader Debugger displays the register contants on the right, the input and output registers in the middle, and the shader code and temporaries registers on the left. Like any good debugger, you can set breakpoints and step through the code. It's available from http://developer.nvidia.com.

Figure 6.3: NVIDIA Shader Debugger.
D3D Shader Debugger
With DirectX 9, you get integration of a shader debugger that integrates with the Visual Studio IDE. Figure 6.4 shows the D3D Shader Debugger. It's available in the extras of the DirectX 9 SDK disk. Just follow the readme instructions and you'll be able to install it.
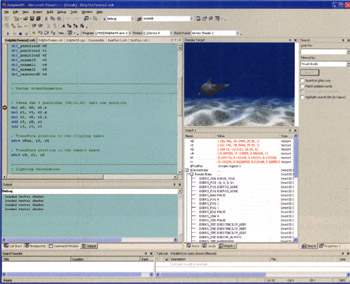
Figure 6.4: The D3D Shader Debugger that shipped with the DirectX 9 SDK.
The version that I got to test (beta 2) required you to start your D3D appliction and then attach to the process. Since the hardware drivers hadn't yet caught up to the release, I had to use refrast as the device. You'd select Direct3D as the program type you wanted to debug. Once that was done you could set break-points in the shader code, modify register values, etc.
[5]I should point out that if you have Visual Studio.NET, then the DirectX 9 SDK comes with the D3D Shader Debugger, which will allow you to debug on any hardware—the cavéat being that you'll probably have to use the reference rasterizer.
|
|
EAN: 2147483647
Pages: 104
- Challenging the Unpredictable: Changeable Order Management Systems
- Enterprise Application Integration: New Solutions for a Solved Problem or a Challenging Research Field?
- Context Management of ERP Processes in Virtual Communities
- Distributed Data Warehouse for Geo-spatial Services
- Healthcare Information: From Administrative to Practice Databases