| Charts can be particularly useful when they display data that is different but complementary. Although it is certainly possible to show data in multiple charts, showing complementary data in the same chart allows direct comparison of information and more efficient use of space. The following steps will walk through a good example of this: 1. | Start by opening the report Chap8Chart.rpt. In the chart that will be added, bars represent the individual stores and a line shows the running total across all stores.
| | | 2. | With the report open, right-click on the field Order Amount and choose Insert, Running Total. When the Create Running Total Field window opens, give the running total a name like Total Order Amount and leave the remaining values as defaults similar to Figure 8.18. Click OK to close the window.
Figure 8.18. Creating this Running Total field will help present a creative use of charts. 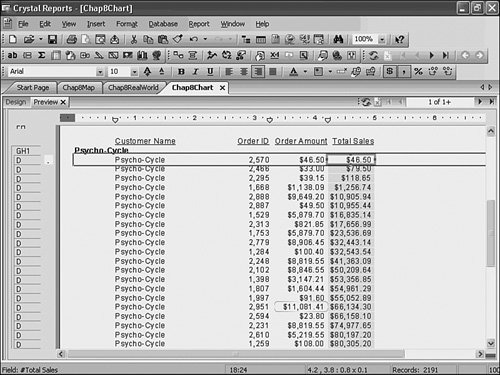
| | | 3. | From the Insert menu, select Chart and place it on your report above the existing chart (you will need to move the original chart down in the same section). Open the new chart's Chart Expert, go to the Data tab and click the Advanced button. Select the Customer Name field and use the upper arrow (>) button to move the field to the On Change Of window. Finally, select the Order Amount and Total Sales fields and add them to the Show Values window using the lower arrow (>) button. The results of this step should resemble Figure 8.19.
Figure 8.19. Creating an advanced chart with a two summary fields will enable some creative charting. 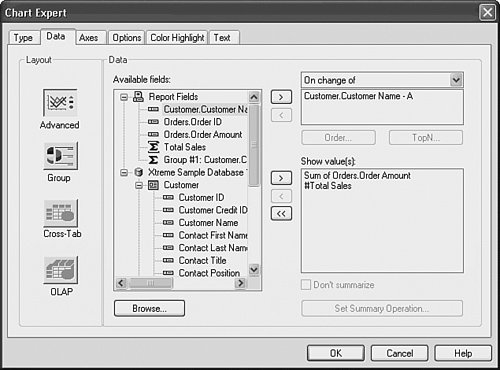
| 4. | Select the Customer Name field in the On Change Of window and click the Top N button. When the Group Sort Expert window opens, select All from the list box and choose Descending. Click OK to close the window.
| 5. | Click the Text tab. Uncheck the Title Auto-Text boxes and type Comparison Chart into the Chart Title text box. Click OK to close the window and return to the report.
| | | 6. | Using the handles on the chart object, stretch the chart to fit the page width. Figure 8.20 provides a good benchmark.
Figure 8.20. Bars representing both Individual Client Sales and Total Cumulative Sales are displayed on the same chart, effectively communicating multiple pieces of information in one chart. 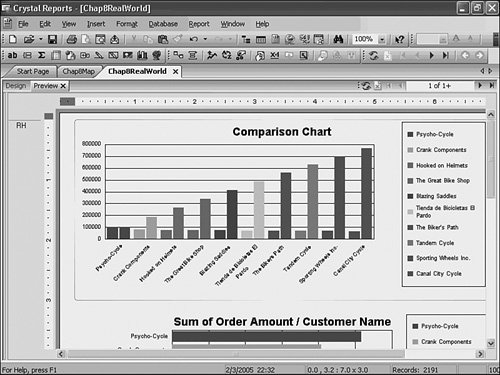
| 7. | Notice that because the Total Sales becomes such a large value, the contrast between individual sales values appears quite small using this scale. To change this, the report will be changed to use a dual Y axis. This enables you to show both sets of values while still highlighting the contrast between individual elements within a set. To change the chart to a dual Y axis, right-click anywhere in the chart and choose Chart Options and then the Axes tab. Click on the Dual Axes box, ensure the Split Dual Axis check box is not checked for this exercise, and then click OK.
| 8. | To enable this chart to better project both sets of information more clearly, you could set a split dual axis back in the Chart Options dialog or you could change the display format of the involved series. To do the latter, first navigate to the Legends tab in the Chart Options menu and change the Color Mode to Color by Series. Next, click any of the individual Total Sales bars to select it, and then right-click the bar and select Chart Options, Series. Change the list box from Default for Chart Type to Line and click OK to close.
| 9. | Save the report.
|
Figure 8.21. Bars represent Individual Client Sales and a line represents Total Cumulative Sales with two separate numeric scales displayed. 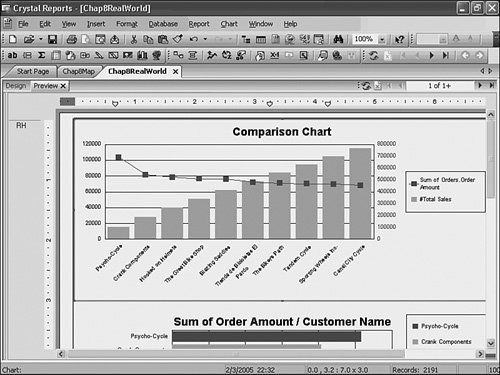
Tip The preceding example provided a great example of displaying different data sets in the same chart. Another practical use of this functionality is displaying averages (or running total calculations) over time in the line chart to complement the other bar chart sums by some specified time period (such as a month). Essentially, you could create a chart that represents a moving average laid on top of the monthly sums.
|