BusinessObjects Live Office Add-in
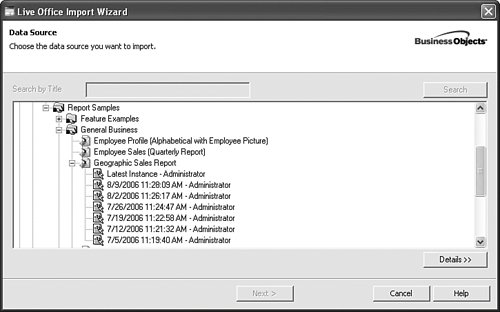
| Because so many information workers today use the Microsoft Office suite and, in particular, Microsoft Excel extensively for worksheet applications and data manipulation, it follows that enterprise report data should also be accessible in Microsoft Excel and other Microsoft Office applications. With the release of XI, the Crystal Reports plug-in for Excel has merged with the former Office add-in to become BusinessObjects Live Office. Live Office provides a bridge between enterprise report data and the applications that are part of an information worker's everyday tasks. Whether the data is needed in a simple table in PowerPoint, or extensive data manipulation is needed in Excel, Live Office provides the link back to a centralized Business Intelligence repository. In this section, we will cover the Live Office add-in in the Microsoft Excel, PowerPoint and Word applications. Architecture and Deployment ScenariosThe Live Office plug-in requires installation on the local machine, and so requires administrative rights on the local machine. The connection between the Live Office plug-in and BusinessObjects Enterprise uses TCP/IP over the local area network. Because of the direct connectivity between Microsoft Office and BusinessObjects Enterprise, an Internet connection does not easily support the plug-in; usually a LAN connection to the BusinessObjects Enterprise server is required. A web services connection is required for Web Intelligence reports. This is configured from the Options menu and then the Web Services tab. Specify the server name of your Business Objects Enterprise Server. Administration and SetupThe installation commences by executing the setup executable on the client machine. Because the plug-in opens Crystal Reports, the BusinessObjects Enterprise server should be configured to grant View, Edit, Refresh, and View instances permissions to the end users who would use this application. The Live Office connector on the BusinessObjects Enterprise system is enabled with a Live Office keycode or a Premium keycode. Connecting to a ReportThe following steps connect to a report:
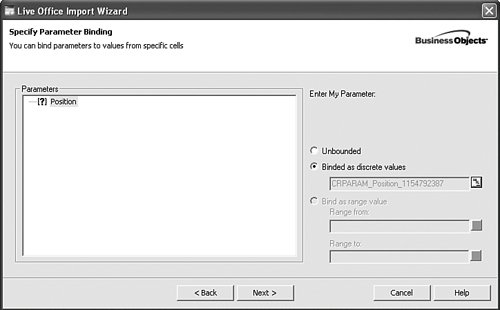
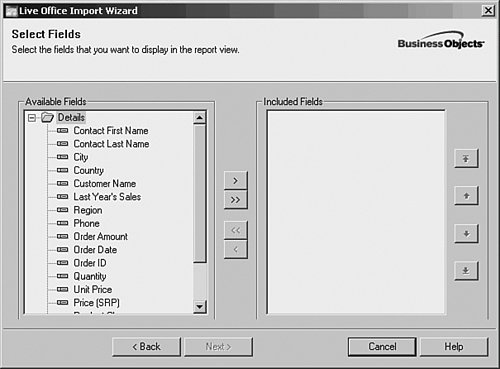
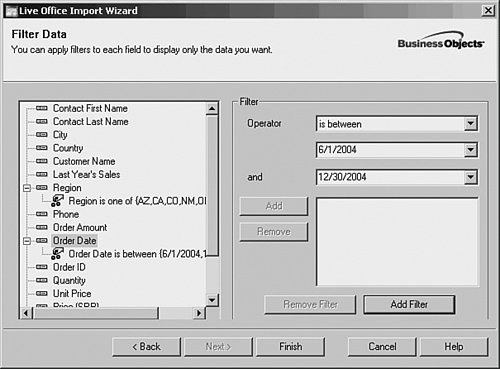
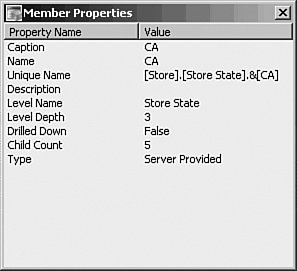
Note If you selected a Web Intelligence report and a context exists, the user is prompted to specify the context. For more on context, see Chapter 18, "Using a Semantic LayerBusiness Views and Universes." Modifying the Report ViewThe data then displays in Excel. Should you then want to modify the report display, both right-click menus and the Business Objects menu enable you to manipulate the data view in real time. To activate the right-click menu, you have to right-click a cell that contains data populated by the Crystal Reports view (typically cells with a light yellow background). The right-click menu has several choices. The Insert choice enables you to insert a blank row or column in the display. The Filter submenu enables you to see only data where the value includes the value you clicked on (the Focus On Value), everything other than the value you have right-clicked on (the Exclude Value option), and the Add/Modify option, which opens the Filters dialog. This enables you to simply right-click a value like USA for country, choose Filters and then Focus On, and see only values for the USA. Choosing the right-click option for Remove does exactly as advertised and clears any filters on the selected column. Note When inserting or deleting rows and columns, notice that a full row or column is inserted within the report view only. Cells outside of the report view do not change. The Field choice on the right-click menu enables you to remove the selected field or open the original Select Fields dialog box where the full list of available and selected fields are listed. The View choice exposes the options available on that report view. The View Report Source choice opens the report in the report viewer where the user can select parts of a report and add them to the current view. The Refresh choice connects to the database and refreshed the data from the database at that moment. The Remove option removes the entire report view from the worksheet; a confirmation dialog is provided when this choice is selected. If the report allows for drilling, the Drill option becomes available, enabling a user to drill up and down the hierarchy of a report, as seen Figure 21.20. Figure 21.20. The Drill option enables the user to drill up and down the hierarchy.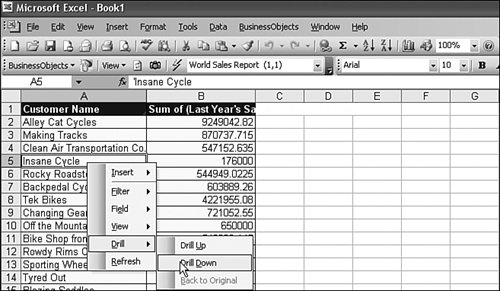 Drilling down the report hierarchy to display the details for the selected line item. The Properties choice opens a dialog with details on the report view like the Report Title, the BusinessObjects Enterprise system supplying the view, the connection ID (useful for troubleshooting), the view ID, the field name, the current value and the field data type. The Data Source choice displays the type of data source connected to (such as data source versus Report instance), whether the particular instance is the latest and when it was run, and if this data comes from an instance at all. The user can change the selected data source in this view, similar to the Set Origin choice from the Crystal Reports Excel Add-in in version 10. The Options choice allows the user to specify the Appearance, Instance, and Formatting options. When the Conceal Data When Saving option is selected, the data is concealed to prevent unauthorized access to the information. The Instance option provides a choice to use always the latest instance or the latest instance for a specified user. The formatting choices provide the option to preserve any end-user formatting when refreshing the report or whether or not to inherit formatting defined in the source report. Finally, the Parameters choice from the View menu opens a dialog to change the parameter values in the report. Lastly, the BusinessObjects Live Office menu offers one option not available from the right-click menu: the Options dialog. This dialog exposes many of the default behaviors of the plug-in. The View tab enables you to specify default data values through the Data Defaults button, and also specify whether you want to conceal the data retrieved when saving the workbook. Additionally, specifying inherit report part or field formatting sets format inheritance on all data views in the workbook. This inheritance option can be overridden on an individual data view as explained earlier. The View tab also provides a choice to display filters and sorts as comments, and whether to display a field by name, description or both. Should you want to change the right-click behavior or how cell widths or cell protection occurs, you accomplish this from the General tab. The Enterprise tab enables you to set a default login for convenience. The Analysis tab is new in version XI and specific to the OLAP Intelligence component of the Live Office add-in. This tab allows you to specify drill-down options and dimension member display options when connecting to an OLAP data source. The Excel plug-in, although simple in terms of usage, results in powerful interactivity. Users value this particular method of accessing report data very highly, as they are accustomed to doing data manipulation in Excel, and the value of having enterprise data from a variety of sources available in this format increases knowledge worker efficiency greatly. Using Live Office with Direct OLAP ConnectionsIn previous releases, the Crystal Analysis add-in for Excel provided users with the capability to connect to OLAP data sources. The Crystal Analysis add-in functionality is now available within the single BusinessObjects Live Office add-in. Instead of connecting to a report or report instance, the Direct OLAP Connection option in the Data Source dialog exposes the list of OLAP connections defined in the BusinessObjects Enterprise XI system. In this way, users can combine data from both Crystal Reports as well as OLAP data sources in a single worksheet. The Business Objects menu now lists Direct OLAP Connections along side of reports, universes, and Business Views. Establishing a direct OLAP connection differs from the predecessor, the Crystal Analysis add-in for Excel, in that it does not report directly from existing OLAP Intelligence workbooks stored in BusinessObjects Enterpriseinstead it connects to a cube and works from there. The BusinessObjects Enterprise ActiveX viewer for OLAP Intelligence reports and the thick client OLAP Intelligence designer also enable exported OLAP Intelligence views to the Live Office add-in and enable continued analysis from within Excel. End users find that the direct OLAP connection offers very much the same interface that they are accustomed to within the OLAP Intelligence worksheet, and offers the capability to massage a view, or several views, at a time, and then tie them together using standard Excel formulas and functionality. This flexibility facilitates much more self-service. The user interface, although powerful, uses simple concepts that enable data manipulation that most users prefer to Excel's own pivot tables, which require quite a bit of training to properly use. Setting Up and Administering Direct OLAP ConnectionsNote from the previous paragraph that the add-in connects directly to the data source. The direct connection from Excel to the data cube uses either the appropriate drivers or Microsoft's Pivot Table Services when connecting to a Microsoft SQL Server Analysis Services cube. Similar to using the OLAP Intelligence Rich Client, these drivers sit on the client machine and connect directly to the data source, compared to using the HTML viewer that directly connects to BusinessObjects Enterprise, which in turn connects to the data source. So direct connectivity to the data sourceusually in the form of a LAN connectionmust be available for Direct OLAP Connections to function properly. The installation requires that an actual set of files be installed on the local machine, which again requires local administrative rights during the install process. Connecting to a WorkbookThis section presupposes that you have already read Chapter 19, "Creating OLAP Intelligence Reports," and Chapter 20, "Introduction to Web Intelligence," which cover OLAP Intelligence in depth. You should also be familiar with the concepts in OLAP and in OLAP Intelligence. Thus the following discussion of direct OLAP connections via the Live Office add-in focuses on how these are implemented, not on the actual functionality. To begin with, you either export a view from the OLAP Intelligence viewer, rich client, or designer, or start a new connection from within Excel through the Business Objects menu. Then you open a new Cube View, connect to a cube using a dialog identical to the one in OLAP Intelligence, and then orient the view in a dialog screen identical to the Worksheet tool in OLAP Intelligence (see Figure 21.21). Figure 21.21. Orienting a cube view using Live Office.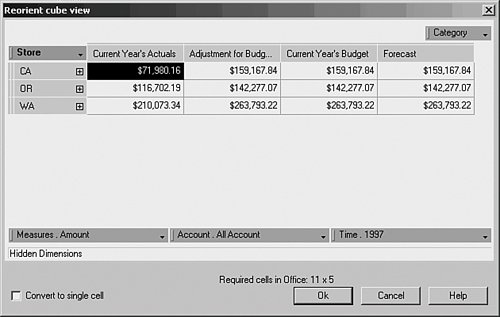 After orienting this view, you choose OK to return to the worksheet with your new view. Here you also have the option to save or open a viewpoint file (an XML file ending in *.cvp), which describes a particular orientation. This creates a cube view in Excel where your cursor was last positioned (see Figure 21.22). Figure 21.22. The Direct OLAP Connection cube view within Excel.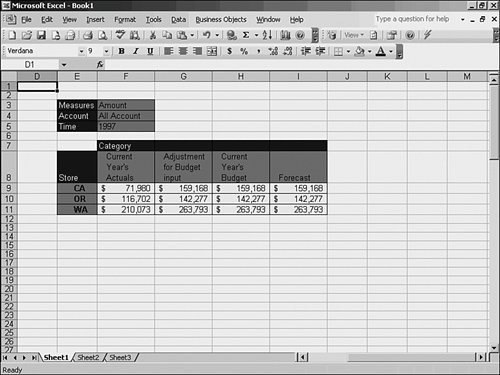 Modifying the Workbook ViewAfter the view has been established within Excel, you can manipulate it just as you did in OLAP Intelligence either by using the Business Objects menu commands or by right-clicking on a cell in the cube view as illustrated in Figure 21.23. Figure 21.23. Right-clicking on a cell displays the Live Office menu.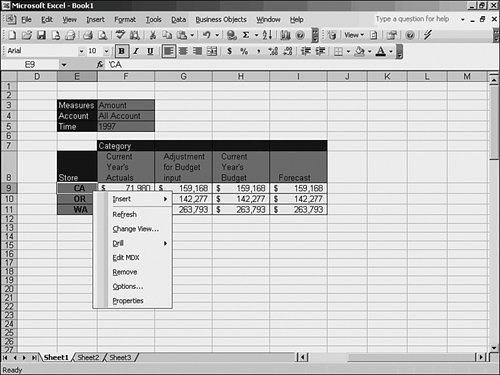 The Live Office right-click menu appears slightly different when positioned on a direct OLAP connection. The menu for each item is discussed next. The Insert item allows a user to insert rows or columns within the context of the view. Inserting a row or column in a view does not affect the cells outside the view. The Refresh option refreshes the current view only. It does not refresh other views. If you want to refresh all views, the Business Objects menu provides the option to do this. If a connection to BusinessObjects Enterprise or the OLAP data source has not yet been established, a logon dialog will appear to confirm you have access to the data source. The Change View option is very similar to the interface provided in InfoView or the OLAP Intelligence designer. In the Reorient Cube View dialog, the user can specify the cube orientation and which dimensions are hidden. The number of required cells are calculated and displayed in the dialog. The Edit MDX menu option is valuable to those skilled in MDX. This syntax, known as Multidimensional Expressions query language, is used for sending requests to Microsoft Analysis Services. A library of functions are exposed through the MDX query panel, as shown in Figure 21.24. Figure 21.24. The MDX Editor invoked by the Edit MDX option.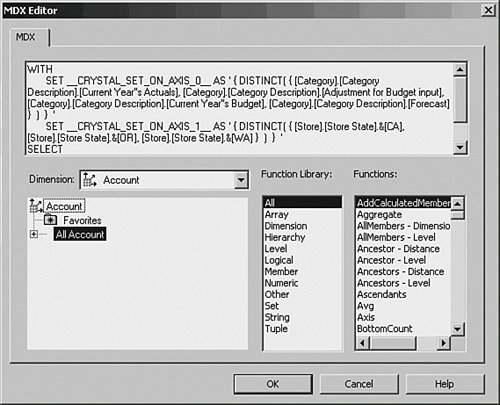 The Remove option on the menu removes the view entirely from the workbook. The Options menu item provides the user with a dialog for specifying View Layout and Formatting options. View Layout relates to displaying or concealing items in the view, such as slice panel and column and row dimension headings. The View Layout is also where Conceal Data When Saving is specified. This is an important feature to keep in mind when dealing with sensitive information. The formatting options are the same as when connecting to a report, Business View, or universe, and relate to retaining custom formatting applied to views. The Properties option displays the Properties dialog. Depending on whether a data cell or dimension member cell is selected, the dialog will either display cell information or dimension information, respectively (see Figure 21.25). Figure 21.25. The Properties Data tab. Also unique to this OLAP view in Excel is the capability to drill up and down by double-clicking on the cells with a [+] or [-] cell. Double-clicking on a dimension label (which is blue by default) opens the Member Selector as well. Clicking and dragging an item, however, does not have the effect of swapping or pivoting dimensions within Excelinstead you will find an area of the worksheet selected. Use the right-click menus to choose Re-orient Cube, which opens the worksheet dialog that supports the click-and-drag operations you are accustomed to within OLAP Intelligence. Using BusinessObjects Live Office in Microsoft PowerPointThe use of enterprise report data in Excel is of great value to the information worker who needs extended analysis capabilities in a spreadsheet environment. However, the value of centrally located enterprise data does not stop at the analyst's desk. Consider the PowerPoint presentations that are created based on the data contained in spreadsheets. Most often, the data in those presentations was placed there using classic cut and paste tactics. This is an enormously resource-intensive process that can be prone to error and is repeatable only at the same cost of resources. BusinessObjects Live Office add-in addresses many of these issues by enabling the PowerPoint user to embed data directly from BusinessObjects Enterprise into a presentation, and in a single action refresh all the data based on the individual view settings. In a single presentation, multiple reports, report instances, Business Views, and OLAP data sources might be used as a basis for a single slide deck (see Figure 21.26). After the presentation has been established, it can be refreshed without repeating the process of rebuilding the entire presentation. Figure 21.26. Live Office in PowerPoint connecting to multiple reports and OLAP data.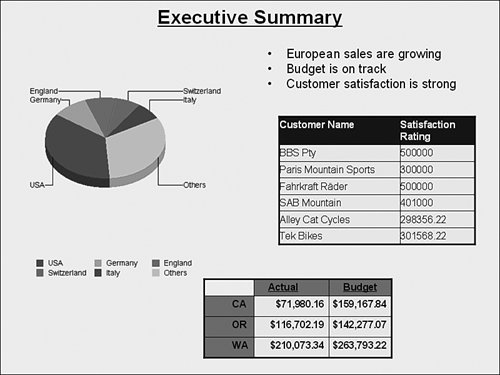 The process for placing data into a PowerPoint presentation uses the exact same menu and right-click functions used in Excel. Refer to the beginning of this section for details on the Insert, Filter, Field, View, Refresh, and Drill functions. Keep in mind that there is a distinction between Live Office in Excel and Live Office in PowerPoint. This distinction reflects the nature of the two different applications as opposed to Live Office itself. It is more likely that higher-level information, report parts, and charts will have a more appropriate use in PowerPoint, the same way long lists of values are appropriate for Excel. Using BusinessObjects Live Office in Microsoft WordIn the same way Live Office in PowerPoint uses the same menu and right-click functionality as Excel, Live Office in Microsoft Word also uses this standard menu. The use of BusinessObjects Live Office in Microsoft Word can provide enormous value as a productivity tool, but in a slightly different way than an Excel or PowerPoint user might leverage information from a BusinessObjects Enterprise system. Documents that combine highly formatted text, such as an annual report, require a top-of-the-line word processing tool. However, those documents often require a number of charts, tables, and other substantive information housed in an enterprise reporting system. Whether it is a financial document or a form letter, the BusinessObjects Live Office add-in simplifies repetitive tasks and provides extreme accuracy when generating documents. The ability to place views into a Word document as illustrated in Figure 21.27 might seem to be of trivial value at first glance. In some cases, however, this could be the difference between meeting a deadline or not. Consider a smaller company with limited staff and no marketing department, per se. Each month the company needs to create and print out a hundred or so special flyers to be including in the monthly mailing to top customers. The flyers advertise special promotions for the upcoming month. Other than the promotions, the flyer stays relatively unchanged each month. Creating a Word document with Live Office views now changes a rather time-consuming task into a matter of opening a document and printing it. Over the course of one year, the time saved on this one monthly task could be as much as one full work week. Figure 21.27. Live Office in Microsoft Word connecting to a report, a Business View, and a universe.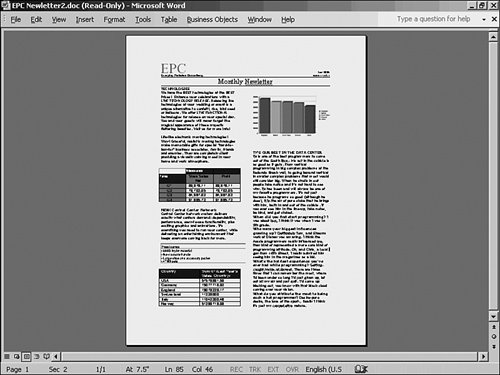 |
EAN: 2147483647
Pages: 365