| The scenario discussed here describes the flexibility behind accessing multidimensional and relational data sources in one report. The benefit of this type of functionality is to enable the user to see aggregated information coming from a cube while allowing drill-down on the relational data to provide greater detail. By using parameters in this report you let the user decide which information elements are displayed. | | 1. | Start by creating a simple sales report against the sample Xtreme data source. For the data, select the First Name, Last Name, and Last Year's Sales fields from the Customer table. Group the Report by Region, City, and then Customer. Hide the Details section and the City and Customer groups and enable drill-down on these sections. The report at design time should look like Figure 16.20. Before moving on, also add Summary fields for Last Year's Sales into each of the Group Header fields (Country, Region, and City).
Figure 16.20. Framework for drill-down integrating both relational and OLAP data. 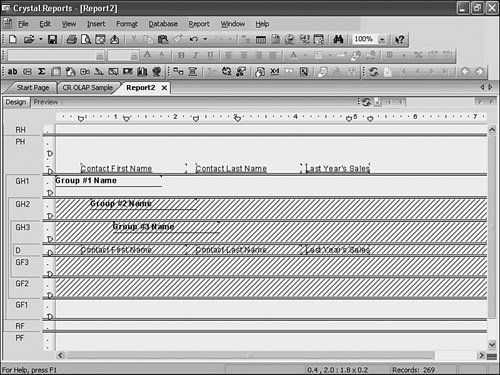
| 2. | Now add an OLAP grid to this report that will go against an offline cube file. Using the steps described earlier in this chapter, point the grid at the sample Holos file xtreme.hdc file located in C:\Program Files\Business Objects\Crystal Reports 11\Samples\en\Databases\OLAP Data (You will have to add a new Holos server through the OLAP Connection Browser previously discussed in this chapter). Keep the defaults assigned by the grid expert except in the Rows/Columns tab; here, you will change the Customer Rows to only include AZ, CA, and MA to limit the number of rows displaying in the report.
| | | 3. | Drop the OLAP Grid in the Report Header area. Now insert a pie chart based on the relational source that displays Last Year's Sales on change of values in the Region field and place the chart in the Group Header for Country to enable the user to also visually understand what the contribution of sales is from each of the selected regions. The report in design view should look similar to Figure 16.21. Also, perform the same filtering task in the report select expert so the relational data source is also limited to the same three states (AZ, CA, and MA).
Figure 16.21. A Report using both OLAP and Relational data sources. The pie chart based on the Relational Data enables drill-down into the relational data details. 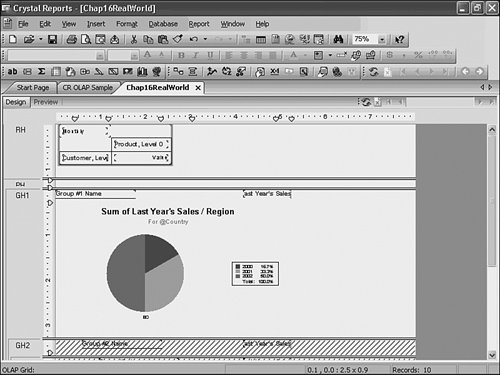
| 4. | If the user viewed this report he would currently see both the chart and the OLAP grid at the top of the report summarizing the same information but sourced from two different data sourcesone, a pre-aggregated Holos data cube, the other a relational database. To enable the end user to turn off the display of the grid, you will create a parameter field that will specify whether to display the grid. This will enable the users to decide if they want to look at the summary information in both a grid and chart format or simply the chart.
| | | 5. | Create a parameter of Boolean type called Display Grid.
| 6. | Next conditionally suppress sections containing the grid and the chart based on the values supplied to the parameters. To do this, right-click on Report Header and select Section Expert from the Report Explorer. Make sure Suppress is checked and then click next to the suppress option on the formula sign. Inside the formula editor type in
{?Display Grid}=false
and close the editor. Now if the user runs the report he will be prompted to select whether he wants to see the the summary OLAP grid. Save the report. On Display, it should look similar to Figure 16.22.
Figure 16.22. Report showing both the OLAP grid and charts and enabling drill-down from the high level summary information displayed from the OLAP grid into the relational details. 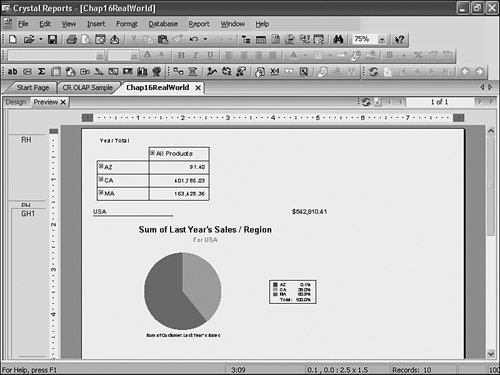
|
This example illustrates combining relational and multidimensional data in one report to allow for different views based on the same underlying data. This allows drill-down on relational elements and provides aggregate information for views on summary OLAP data. |