Grouping and Sorting Report Data
| Most reports you create require that you organize the data into groups and subgroups in a style similar to the outline of a book. The Report Wizard lets you establish the initial grouping and sorting properties for your data, but you might want to rearrange your report's data after reviewing the Report Wizard's first draft.
Figure 17.1. Use the Sorting and Grouping dialog to classify and sort your reports by numeric or alphabetic values. Property values you set in the Sorting and Grouping dialog determine the fields or expressions on which Access is to group the products, up to a maximum of 10 fields or expressions. You can sort the groups and grouped data in ascending or descending order, but you must select one or the other; "unsorted" isn't an option. The small Sorting and Grouping icon in the selection button at the left of the window indicates that Access uses the field or expression in the adjacent column to group the records. Grouping DataThe method that you use to group data depends on the type of data in the field you plan to group. You can group by categories, in which case a unique value must represent each category. You can group data by a range of values, which usually are numeric but also can be alphabetic. You can use the data in a field to group the report rows, or you can substitute an expression as the basis for the grouping. Note
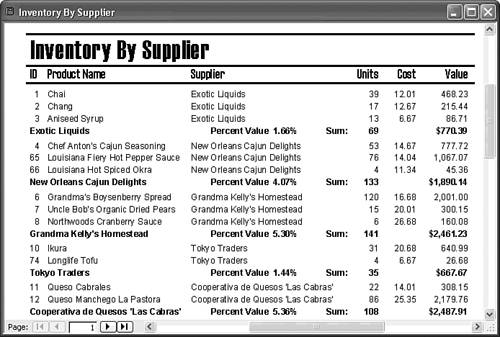
Grouping by Numeric ValuesWhen you told the Report Wizard in the preceding chapter to use CategoryID as the field by which to group, you elected to group by a numeric value. You can alter the grouping sequence easily by using the Sorting and Grouping dialog. For example, you can group the inventory report by SupplierID to aid in comparing the inventory turnover rate of products from multiple suppliers. The report you create in the later "Working from a Blank Report" section provides some insight into inventory turnover by product category, not by supplier.
To group the Inventory by Category report by SupplierID, do the following:
Grouping by Alphabetic Code CharactersIf you use a systematic code for grouping, you can group by the first five or fewer characters of the code field. With an expression, you can group by any set of characters within a field. To group by the second and third digits of a code, for example, use the following expression: =Mid([FieldName], 2, 2) Mid's first numeric argument is the position of the starting character on which to group, and the second is the number of characters to use for grouping. Grouping with SubgroupsIf your table or query contains appropriate data, you can group reports by more than one level by creating subgroups. The Employee Sales by Country report (one of the Northwind Traders sample reports), for example, uses groups (Country) and subgroups (the employee's name the actual group is a VBA expression that combines the FirstName and LastName fields to organize orders received within a range of dates. Open the Employee Sales by Country report in Design view to view the additional section created by a subgroup. Change to Print Preview, and type 1/1/1996 and 12/31/1998 as the values of the Beginning Date and Ending Date Enter Parameter Value dialogs to view all orders. Using a Function to Group by RangeYou often must sort reports by ranges of values. (If you opened the Employee Sales by Country report, close it and reopen the rptInventoryByCategory report in Design mode.) If you want to divide the Inventory by Category report into a maximum of nine sections each beginning with a three-letter group of the alphabet (A through C, D through F, and so on) based on the ProductName field the entries in the Sorting and Grouping dialog should look like the entries in Figure 17.4. Figure 17.4. Set the Group By properties to those shown here to group product names by a three-initial-letter interval. Alphabetic grouping demonstrates a grouping bug that's been present since Access 2.0. VBA's =Asc([ProductName]) function returns the ASCII (numeric) value of the first character of its string argument, the ProductName field. You set the Group On specification to Interval and then set the Group Interval to 3. This setup theoretically groups the data into names beginning with A through C, D through F, and so on. You must add an ascending sort on ProductName to assure alphabetic sorting within the group (see Figure 17.5). You delete all text boxes in the Group Footer because subtotals by alphabetic groups aren't significant. Although of limited value in this report, an alphabetic grouping often is useful for formatting long, alphabetized lists to assist readers in finding a particular record. Figure 17.5. A bug in Access's interval grouping process when using a VBA expression causes grouping by A, B to D, E to G, and so on. This bug has been present since Access 2.0. Grouping on Date and TimeIf you group data on a field with a Date/Time data type, Access lets you set the Sorting and Grouping dialog's Group On property to Year, Qtr (quarter), Month, Week, Day, Hour, or Minute. To group records so that values of the same quarter for several years print in sequence, type the following in the Field/Expression column of the Sorting and Grouping dialog: =DatePart("q",[FieldName])
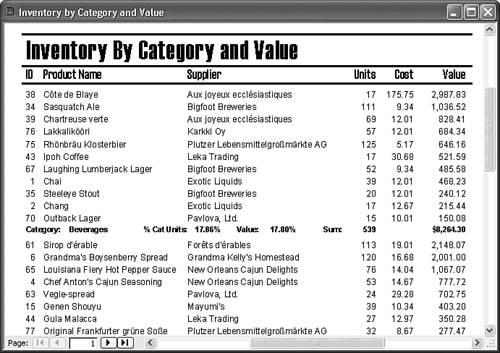
Sorting Data GroupsAlthough most data sorting within groups is based on the values contained in a field, you also can sort by expressions. When compiling an inventory evaluation list based on the original Inventory by Category report, the products with the highest extended inventory value are the most important. The report's users might want these products listed first in a group. This decision requires sorting the records within groups on the expression =[UnitsInStock]*[UnitPrice], which is similar to the expression that calculates the report's Value column. (You don't need to account for the constant markup multiplier when sorting.) A descending sort is necessary to place the highest values at the top of the report. Figure 17.6 shows the required entries in the Sorting and Grouping dialog. Figure 17.6. The expression in the second row of the Sorting and Grouping dialog places items with the largest inventory value at the top of each CategoryID group. The descending sort on the inventory value expression results in the report shown in Figure 17.7. As expected, the products with the highest inventory value appear first in each category. Figure 17.7. The grouping and sorting properties shown in Figure 17.6 result in a report that places emphasizes on the most important elements within a group. |

 To review the Report Wizard process,
EAN: 2147483647
Pages: 417