| This section shows you how to use the Report Wizard to create a grouping report based on data in the Products and Suppliers tables of the Northwind Traders sample database. (Like the Form Wizard, the Report Wizard lets you create reports that contain data from more than one table without first creating a query.) This report displays the quantity of each specialty food product in inventory, grouped by product category. Note The process of designing an Access data projects (ADP) report is, for the most part, identical to that for conventional Access reports based on Jet 4.0 data sources. The difference is that ADP use an SQL Server table, view, function, or stored procedure as the data source for the report. ADP doesn't support some Jet features, such as domain aggregate functions, but the workarounds for ADP limitations are relatively simple. Chapter 22, "Upsizing Jet Applications to Access Data Projects," describes the principal workarounds required when migrating from Jet applications to ADP.
Creating an inventory report begins with modifying the basic report created by the Report Wizard. The process of creating a basic report with the Report Wizard is similar to the process that you used to create a form with a subform in Chapter 14. An advantage of using the Report Wizard to introduce the topic of designing Access reports is that the steps for this process are parallel to the steps you take when you start with a default blank report. Chapter 17, "Preparing Advanced Reports," explains how to start with a blank report and create more complex reports. To create an Inventory by Category report in Northwind.mdb, follow these steps:  Click the Reports shortcut in the Database window and then click the New button. Access displays the New Report dialog. The New Report dialog lets you choose one of three report wizards, two AutoReport styles, and Design view. Click the Reports shortcut in the Database window and then click the New button. Access displays the New Report dialog. The New Report dialog lets you choose one of three report wizards, two AutoReport styles, and Design view.
Like forms, reports require a data source, which can be a Jet table or query, or an ADP table, view, function, or stored procedure. For this example, select the Products table from the choices offered in the New Report dialog's drop-down list (see Figure 16.1). Select Report Wizard from the list in the dialog's right side and click OK to open the Report Wizard's first dialog. Figure 16.1. Select a table or query as the data source for your report, and then choose the Report Wizard in the New Report dialog.  Tip You can bypass the New Report dialog and open the Wizard directly by double-clicking the Create Report by Using Wizard shortcut in the Database window. In this case, you select the report's data source in the first Wizard dialog. The fields that you select to display represent columns of the report. You want the report to print the product name and supplier so that users don't have to refer to another report to associate codes with names. The fields from the Products table that you need for this report are CategoryID, ProductID, ProductName, SupplierID, and UnitsInStock. With the > button, select these fields in sequence from the Available Fields list. As you add fields to the Selected Fields list, Access removes the field names from the Available Fields list. Alternatively, you can double-click the field name in the Available Fields list to move the field name to the Selected Fields list. The fields appear from left to right in the report, based on the top-to-bottom sequence in which the fields appear in the Selected Fields list. To demonstrate how the Wizard deals with reports that bind to more than one table, add the CompanyName field from the Suppliers table. Open the Tables/Queries drop-down list and select Table: Suppliers. Tip You can retrace your steps to correct an error by clicking the Back button whenever it is enabled. The Finish button accepts all defaults and jumps to the end of the Wizard, so you shouldn't use this button until you're familiar with the Report Wizard's default selections. Instead of presenting the supplier name as the report's last field, you want the report's CompanyName column to follow the SupplierID report column. Select the SupplierID field in the Selected Fields list. Now select the CompanyName field from the Available Fields list and click the > button. Access moves the CompanyName field from the Available Fields list and inserts the field into the Selected Fields list (see Figure 16.2). Click Next. Figure 16.2. After selecting the fields from the primary table, select the SupplierID field, and add the CompanyName field of the Suppliers table in the first Wizard dialog.  Note The purpose of adding the CompanyName field of the Suppliers table is to demonstrate how the Wizard handles the design of reports based on more than one table. If you don't add the CompanyName field, the Wizard dialog of step 6 doesn't appear. The SupplierID field of the Products table is a lookup field, so CompanyName appears in lieu of the numeric SupplierID value. You remove the duplicate field when you modify the report later in the chapter. The Report Wizard asks how you want to view the data in the report. Notice the Show Me More Information button near the left center of the Wizard dialog. Click this button to display the first of a series of hint dialogs for the Report Wizard. If you click the Show Me Examples option, Access displays additional hint screens. These screens use examples from the Sales Reps, Customers, and Orders tables to show you the different groupings that the Report Wizard can automatically add to the report. Click the Close button repeatedly until you return to the Report Wizard dialog shown in Figure 16.3. Figure 16.3. Select the Products table as the basis for your Report in the second Wizard dialog.  For this report, you select your own groupings. Accept the default By Products item in the list and click Next to continue. The Report Wizard asks whether you want to add any grouping levels to the report. Select the CategoryID field in the list and click the > button to establish the grouping by the Products' category, as shown in Figure 16.4. Figure 16.4. Specify the field on which you want to group your report in the third Wizard dialog.  Click the Grouping Options button to open the Grouping Intervals dialog shown in Figure 16.5. By changing the grouping interval, you can affect how Access groups data in the report. For numeric fields, you can group items by 10s, 50s, 100s, and so on. For text fields, you can group items based on the first letter, the first three letters, and so on. The Wizard checks the field data type and suggests appropriate grouping intervals. Figure 16.5. The Normal option groups numeric fields by individual values. You also have the option to group numeric fields by seven ranges of values.  Tip If your application uses a text-coding scheme, such as BEVA for alcoholic beverages and BEVN for nonalcoholic beverages, you can combine all beverages in a single group by selecting 1st 3 Characters from the Grouping Intervals list. Access 2003 provides this option for numeric fields and for fields of the Text data type.  For additional methods of grouping data by characters in the field, see "Grouping and Sorting Report Data," p. 678. For additional methods of grouping data by characters in the field, see "Grouping and Sorting Report Data," p. 678.
This report doesn't require any special grouping interval, so accept Normal in the Grouping Intervals list, click OK to return to the Report Wizard, and click Next. You can sort the records within groups by any field that you select (see Figure 16.6), with up to four different sorted fields. The dialog doesn't offer CategoryID as a choice because the records already are grouped on this field, and the field on which the grouping is based is sorted automatically by the table's primary key. Select ProductID in the first drop-down list. Figure 16.6. In the fourth Wizard dialog, select the field on which to sort records within the group you specified in the third dialog. 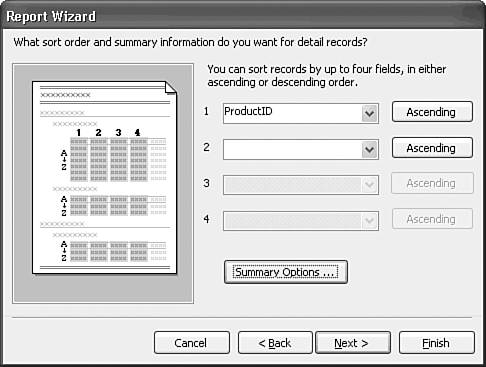 Note By default, the sort order is ascending; if you want a descending sort order, click the button to the right of the drop-down list. (This button is a toggle control; click it again to return to an ascending sort.) Click the Summary Options button to display the Summary Options dialog. If you want to add summary information to a report column, you set the options for that column in this dialog. The Report Wizard lists all the numeric fields on the report that aren't AutoNumber fields and offers you check boxes to select a Sum, Average, Minimum, and Maximum for that report column. Depending on the check boxes that you select, the Report Wizard adds those summary fields to the end of the report. The Show option group lets you select whether the report shows the summary fields only or the full report with the summary fields added at the end of each group and at the end of the report. For this report, select the Sum and Avg check boxes for the UnitsInStock field, the Detail and Summary option, and the Calculate Percent of Total for Sums check box (see Figure 16.7). The Calculate Percent of Total for Sums check box displays the group's total as a percentage of the grand total for all groups. Click OK to return to the Report Wizard dialog, and click Next. Figure 16.7. The Summary Options dialog lets you add to your report values based on calculations on numeric fields (other than AutoNumber fields).  The Wizard asks you to select a layout for your report. The window on the left shows a preview of the layout style that you select; click each of the six option buttons to check the layouts. For this report, select Stepped in the Layout option group (see Figure 16.8). Figure 16.8. The Stepped report layout is the most common choice for reports with a few columns. You can increase the number of columns per page by choosing one of the Align Left layouts.  By default, the Report Wizard selects the Adjust the Field Width So All Fields Fit on a Page check box. As a rule, you should select this option to save paper and make your report more legible. In the Orientation option group, you select the report's printing orientation. Make sure that you select the default Portrait option. Click Next. Tip When you restrict field widths to fit all fields on a page, fields with long lines of text often are truncated in the final report. You can adjust field widths in Report Design view to accommodate long text lines or change to multiline text boxes. Select one of the predefined report styles for your report. The window on the left shows a preview of the selected style (see Figure 16.9). (You can customize or create your own styles for the Report Wizard to use. This activity is described in the "Using AutoFormat and Customizing Report Styles" section later in this chapter.) Select the Compact style to reserve the maximum space for detail columns, and then click Next to display the final Report Wizard dialog. Figure 16.9. Choose one of the six predefined printing styles for the report. 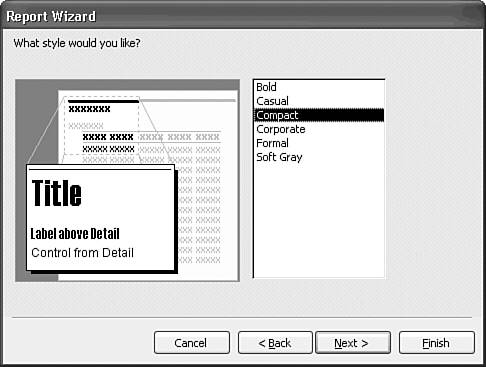 Type rptInventoryByCategory as the title for the new report; the Report Wizard uses this title as the name of the saved report it creates (see Figure 16.10). Select the Preview the Report option, and click Finish to complete your report specification. The Report Wizard creates the report and displays it in Print Preview mode. Figure 16.10. Type the name to save your report under in the last Wizard dialog. You change the report's caption to "Inventory by Category" later in the chapter. 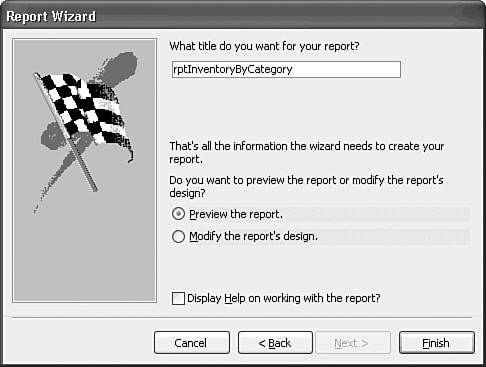
Figure 16.11 shows the basic report that the Report Wizard creates, which has some major design deficiencies that you correct in the sections that follow. Use the vertical and horizontal scroll bars to position the preview as shown. When you're finished previewing the report, close it. Figure 16.11. The report generated by the Wizard doesn't provide space to display the full heading for the Units in Stock caption in the page header.  Tip  | Unlike Access's record navigation text boxes, Print Preview's Page text box shows only the current report page. To obtain a page count, the Access report engine must paginate the report; pagination can take a considerable period of time for very long reports. To display the total number of report pages in the Pages text box, click the Last Page button (arrow and bar) at the bottom of the Print Preview window. |
With a few design modifications, you can obtain a finished report with the information necessary to analyze Northwind's current inventory. The modifications correct obvious defects in the Wizard-designed report, such as the excess width of the CategoryID column, cut-off names in the Product Name column, duplication of the Supplier and Company Name columns, and the truncated Units in Stock heading. You make these changes in the "Modifying a Basic Wizard Report" section later in this chapter. |