Debugging the Service
Because a service must be run from within the context of the Service Control Manager, rather than from within Visual Studio 2005, debugging a service is not as straightforward as debugging other Visual Studio 2005 application types. To debug a service, you must start the service and then attach a debugger to the process in which it is running. You can then debug the application using all of the standard debugging functionality of Visual Studio 2005.
| Important | Don’t attach to a process unless you know what the process is and understand the consequences of attaching to and possibly killing that process. |
To avoid going through this extra effort, you may want to test out most of the code in your service in a standard Windows Forms application. This test-bed application can have the same components (FileSystemWatchers, EventLogs, Timers, and so on) as the Windows Service, and thus will be able to run the same logic in events. Once you have checked out the logic in this context, you can just copy and paste it into a Windows Service application.
However, sometimes the service itself needs to be debugged directly, so it’s important to understand how to attach to the service’s process and do direct debugging. You can only debug a service when it’s running. When you attach the debugger to the service, you are interrupting it. The service is suspended for a short period while you attach to it. It is also interrupted when you place breakpoints and step through your code.
Attaching to the service’s process enables you to debug most, but not all, of the service’s code. For instance, because the service has already been started, you cannot debug the code in the service’s OnStart method this way, or the code in the Main method that is used to load the service. To debug the OnStart event or any of the Visual Studio 2005 designer code, you have to add a dummy service and start that service first. In the dummy service, you would create an instance of the service that you want to debug. You can place some code in a Timer object and create the new instance of the object that you want to debug after 30 seconds or so. Allow enough time to attach to the debugger before the new instance is created. Meanwhile, place breakpoints in your startup code to debug those events, if desired. Follow these steps to debug a service:
-
Install the service.
-
Start the service, either from the Service Control Manager, from Server Explorer, or from code.
-
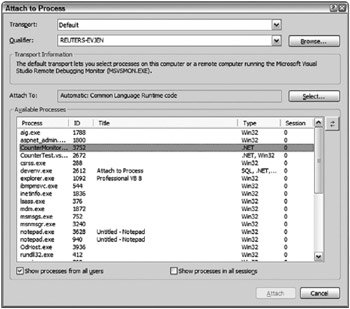
In Visual Studio 2005, load the solution for the service. Then select Attach to Process from the Debug menu. The Attach to Process dialog box appears (see Figure 31-12).

Figure 31-12 -
For a Windows Service, the desired process to attach to is not a foreground process; be sure to check the check box next to the “Show processes from all users” option.
-
In the Available Processes section, click the process indicated by the executable name for the service, and then click Attach.
-
You can now debug your process. Place a breakpoint in the code for the service at the place you want to debug. Cause the code in the service to execute (by placing a file in a monitored directory, for example).
-
When finished, select Stop Debugging from the Debug menu.
Let’s go through an actual scenario, using our earlier CounterMonitor example. Bring up both the CounterMonitor project and the CounterTest project in separate instances of the Visual Studio 2005 IDE. Make sure that the CounterMonitor service has been started. It is best if you hear it beeping - that way you know it is working. If necessary, increment the performance counter to make it beep.
In the CounterMonitor project, select Debug ![]() Processes; you’ll get a dialog box that shows a list of the foreground processes on the system. Check the box next to “Show system processes.” This will expand the list of processes, and one of the processes in the list will be CounterMonitor.exe. Highlight it and click Attach.
Processes; you’ll get a dialog box that shows a list of the foreground processes on the system. Check the box next to “Show system processes.” This will expand the list of processes, and one of the processes in the list will be CounterMonitor.exe. Highlight it and click Attach.
You’ll then get a dialog box asking you what program types you are interested in debugging. Because we are working solely within .NET, check the box next to Common Language Runtime and leave the rest unchecked. Press the OK button, and then press the Close button on the Processes dialog box. You are now attached to the process running CounterMonitor in the background.
Place a breakpoint on the first line of the OnCustomCommand event:
Timer1.Enabled = False
Now you are ready to check debugging. Bring up the CounterTest program and start it. Press one of the radio buttons to change the beep interval. You will hear the beeping stop because CounterMonitor .exe has entered debugging mode. Switch back to the CounterMonitor project. The cursor will be on the breakpoint line in OnCustomCommand. You can use the normal commands at this point to step through the code.
EAN: 2147483647
Pages: 267