Debugging XSLT
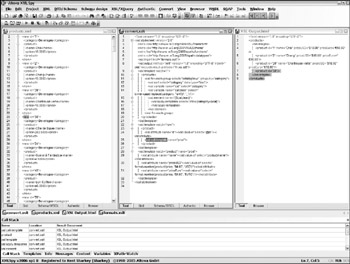
Just as with any programming effort, it is difficult to get it right the first time. Therefore, many of the XML-processing tools shown in Chapter 2 include XSLT debugging to help you correct any logic errors you may make when writing XSLT stylesheets. Just like code debuggers, these tools enable the developer to step through the templates, examine variables, and set breakpoints to determine how the stylesheet is processing. Figure 8-7 shows a debugging session in Altova XMLSpy. One of the nice features of this debugger is that you can see your script, source document, and result document at the same time as you debug the script.

Figure 8-7
A number of the product nodes have been processed, as you can see from the output panel. This output is built up as the value-of nodes are executed.
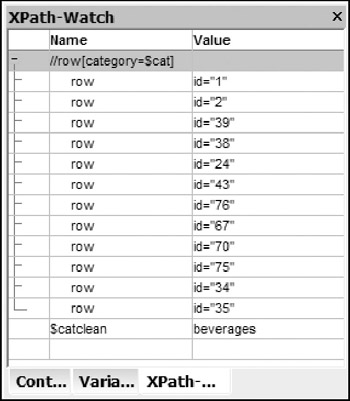
Creating breakpoints allows you to ignore the parts of your document that are working as expected. Set a breakpoint at the point in the source document that you want to debug. Then, run the debugger; execution will pause at the breakpoint. The XPath-Watch window (see Figure 8-8) provides insight into the current context and variables. You can then step line by line or template by template through the script as the output document is generated.

Figure 8-8
EAN: 2147483647
Pages: 215