Using Advanced Cross-Tab Features

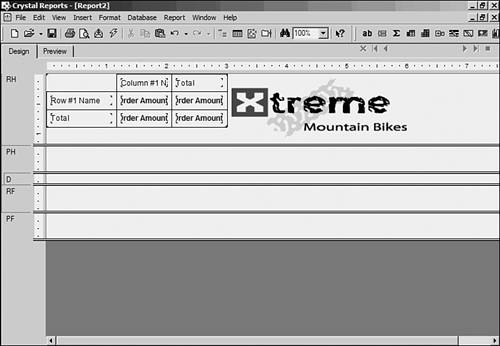
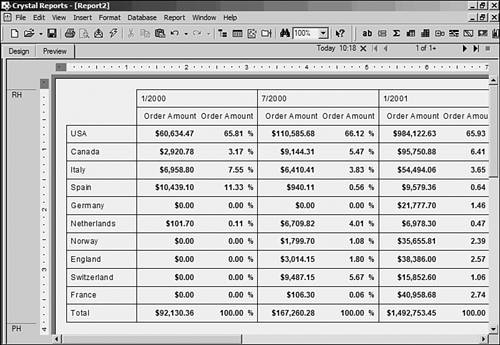
Crystal Reports version 9 includes significant cross-tab improvements in that they are even more customizable and easy to work with. The advanced features give cross-tabs improved flexibility and functionality to satisfy even more reporting requirements.

We'll continue to improve the Xtreme Mountain Bikes report (crosstab2.rpt) that we've already started to further demonstrate these new features.

Relative Position

When it comes to planning the width or length of cross-tabs, they can be thought of as an accordion. With the addition of new information or data, the number of rows or columns can grow or shrink. This makes putting objects at the end of a cross-tab very difficult because it's unclear when the object will be overwritten (if new data comes along).

The bottom of a cross-tab has an easy solution. Just put the new object in the next report section even if it means adding a new section. By default, objects in Crystal Reports will not overwrite a section, so the solution is a simple one.

However, the columnar situation (number of columns) is another problem altogether. In the Xtreme report, management wants the Xtreme logo to be displayed to the right of the cross-tab. But, in Design, the size of the cross-tab doesn't match what we see in Preview. We will need to use a section format property called Relative Position to get the image in the desired place.

Let's work through an example to see the result:

  1. Open crosstab2.rpt. Let's start with our last saved document by choosing it from the File list at File, Open.

  2. Insert the logo image from the Repository. In Design mode, open the Repository by choosing View, Repository Explorer. Navigate to the Images folder and select the Xtreme Logo. Drag it to the right of the cross-tab and drop it there, as shown in Figure 14.6.

    Figure 14.6. Design with Cross-tab and image side by side.

    graphics/14fig06.jpg

    graphics/bookpencil_icon.gif

    We are not focusing on the Repository in this hour. For more information on the Repository, please see Hour 18.


  3. Preview the report. Click F5 to see the result. It's not exactly as we intended.

  4. Set the Relative Position property. Right-click on the Report Header label (on the left where it says Report Header, or RH, in the gray area). Choose Section Expert. Toggle the Relative Positions check box and click OK. To see the resulting report is what Xtreme management wanted, as shown in Figure 14.7.

    Figure 14.7. Preview of the cross-tab and image as requested.

    graphics/14fig07.jpg

graphics/lightbulb_icon.gif

Notice that Crystal Reports creates a second horizontal page to handle the need in this report. If a cross-tab needs a second page, it's created automatically.


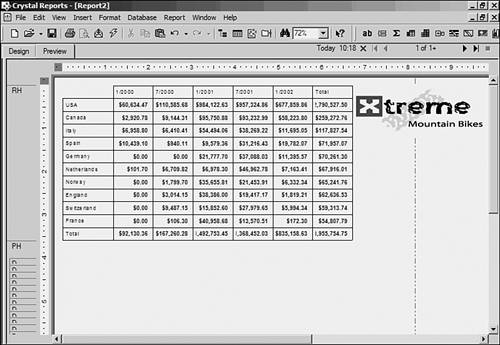
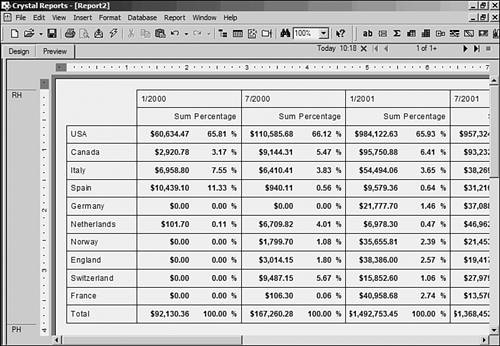
The Relative Position property works on the left, top, and right borders of the cross-tab. Remember that the bottom border of the cross-tab is handled by the end of a section. Relative Positions can be used in many situations. For example, showing a chart on the information in the cross-tab can be very useful.

Percentage of Summary

Summary values can also be displayed as percentages of either the total rows or total columns. Let's assume that the management at Xtreme needs this in their report as well.

Let's continue on with our report:

  1. Add another summary. Right-click in the top left of the cross-tab where no data appears and choose Cross-Tab Expert. In the Cross-Tab step, choose to add the CustomerOrdersShipped.Order Amount to the Summarized Fields list box by clicking the arrow (>) button. Notice that it looks like it duplicates the summary above it, so choose the Change Summary button.

  2. Change the Summary to a Percentage Summary. In the Edit Summary dialog, select Show As Percentage Summary. Notice that it has an option for Row or Column. In Xtreme's case, management wants to know by country (row) where the percentage split is, so keep Row selected as shown in Figure 14.8.

    Figure 14.8. The Edit Summary dialog.

    graphics/14fig08.gif

  3. Preview the results by clicking OK on both dialog windows. It should look like Figure 14.9.

    Figure 14.9. Percentages by country.

    graphics/14fig09.jpg

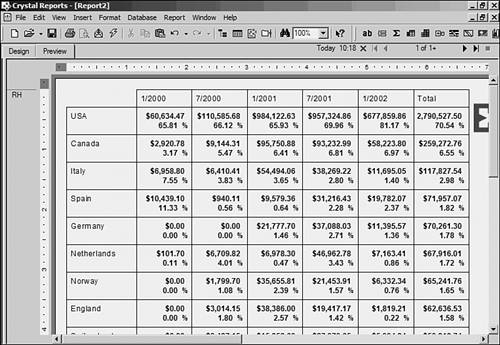
Notice that the USA is consistently the largest percentage of Xtreme's orders. It's very easy to see this when percentages are added to the cross-tab.

Of course, the look of the cross-tab is not yet ideal. More advanced formatting will help in this matter.

Horizontal and Vertical Placement

Because the percentages add up to 100% down the page, it would be easier to understand if the summaries could be displayed side by side instead of one on top of the other. That way, the numbers down the page could be added up easily.

Crystal Reports allows the toggle between horizontal and vertical placement of summaries, so let's make this update to the Xtreme report.

  1. Launch the Cross-Tab Expert. Right-click in the top-left of the cross-tab again and choose Cross-Tab Expert. Select the Customize Style tab. Under Summarized Fields, choose Horizontal as well as selecting the Show Labels option.

  2. View the report. Click the OK button and see the changes made to the cross-tab. Figure 14.10 shows an example.

    Figure 14.10. Horizontal placement of summaries.

    graphics/14fig10.jpg

graphics/alarmclock_icon.gif

It's been a while since a Save has been done. Save reports often or use the Autosave option, located from the File menu at Options, Reporting. To be on the safe side, save at the end of each set of steps.


Summary Labels

Notice that on the report in Figure 14.10, both titles for the percentage and the summary are exactly the same (Order Amount). This is because Crystal Reports is showing the field that a summary is acting on. In this case, where the field is being acted on twice, it's not a good choice.

Crystal Reports allows you to edit these labels right on the cross-tab in both Design and Preview modes.

  1. Edit the Summary's Title. Right-click on the first Order Amount field in the cross-tab and choose Edit Text. Delete the Order Amount Text and add Sum instead. Click off the object and see the result.

  2. Edit the Percentage Title. Repeat the previous step for the second Order Amount field, but instead of changing the text to sum, change it to %, as shown in Figure 14.11.

    Figure 14.11. Cross-tab with both labels changed.

    graphics/14fig11.jpg

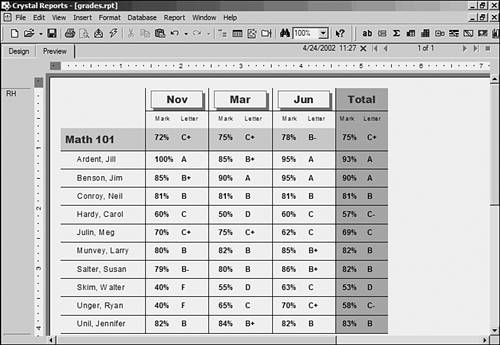
The formatting of this cross-tab is coming along, and Xtreme is very happy with its progress. There is one more requirement before the report can be submitted as complete.

Adding a Display String

Cross-tabs are based on the need for numbers or currency to be summarized, but there are times when the numbers don't need to be seen to get the point across. Instead of seeing the numbers, why not show something more inventive?

Crystal Reports has a feature for all fields called Display String. This formatting feature allows a different representation for a field than its underlying value. For example, what if a teacher wanted to see a grade letter beside a percentage mark, as shown in Figure 14.12?

Figure 14.12. Math 101 marks with letter grades as display strings.

graphics/14fig12.jpg

As previously mentioned, cross-tab cells are always an intersection of rows and columns with a summary because the strings are the visual representation of the underlying summary being computed in the cross-tab. We can affect this string using the advanced Cross-Tab features of Crystal Reports.

Crystal Reports can now separate the data value from its display. This is a powerful feature and is not limited to cross-tabs; although it plays a major role in cross-tabs because of the requirement of summaries.

To complete this report, Xtreme's management team requires that all $0.00 amounts be shown as NONE on the report.

  1. Format the Order Amount Summary. Right-click on one of the $0.00 amounts on the report and choose Format Field. Choose the Common Tab and then choose the Conditional Formatting (x+2) button to the right of Display String. The Formula Workshop will appear.

  2. Format Formula for strings. Use an If-Then-Else formula structure to accomplish the task. The final result will be If CurrentFieldValue = 0 Then "NONE" Else ToText(CurrentFieldvalue) (see Figure 14.13).

    Figure 14.13. Display String formatting formula.

    graphics/14fig13.gif

    graphics/lightbulb_icon.gif

    Try to avoid using explicit field names in these formulas so that they can be reused in other places.

    Also, remember that these are string formulas. That's why the ToText is needed around the CurrentFieldValue. Both Then and Else clauses must contain similar data type results.


  3. Close the dialog windows. Choose the Save and Close button on the Formula Workshop and then the OK button on the Formatting dialog. See the result as shown in Figure 14.14.

    Figure 14.14. $0 changed to NONE by using the Display String feature.

    graphics/14fig14.jpg

  4. Save the report as Crosstab3.rpt by choosing File, Save As.


Sams Teach Yourself Crystal Reports 9 in 24 Hours
ISBN: B003D7JUVW
EAN: N/A
Year: 2005
Pages: 230

flylib.com © 2008-2017.
If you may any questions please contact us: flylib@qtcs.net