Debugging Your Templates
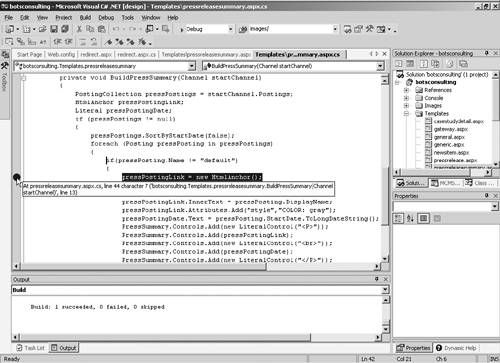
| Now that you've created your template, you'll probably want to test it to make sure it works. The preview feature probably works fairly well for the quick "acid test," but it doesn't really give you an accurate indication of whether your template will operate properly in production. As we mentioned earlier in the chapter, debugging CMS projects can be slightly different from debugging typical ASP.NET projects (if you've ever worked with Visual Interdev and gotten the debugging to work you're already familiar with one technique). Although templates are ASPX pages, as you learned in Chapter 11, the process of rendering a page involves a few steps. As a result, you have to use one of two techniques for debugging your templates. Depending on your comfort, you may choose to use one technique over another, but they both work equally well. Attaching to the ASP.NET ProcessBecause templates aren't executed directly, you can't simply run the project as you have with other ASP.NET projects. The first technique is attaching to the ASP.NET process. If you have had experience with CMS 2001, this is similar to what debugging was like in Visual Studio 6. Unlike in VS6, this works fairly well. To begin, you'll want to open a template within your project and set a breakpoint. The easiest way to do that is to click in the left margin, next to the line of code on which you'd like VS.NET to break. In Figure 12-16, you can see what this looks like. Figure 12-16. Setting a breakpoint in your code
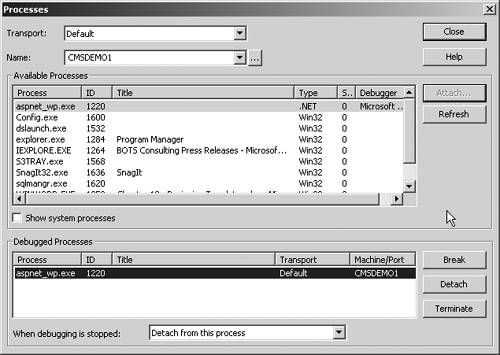
In our example, we're using the BOTS Consulting Press Release Summary template. We've set a breakpoint at the line of code where we're creating a new HTMLAnchor object. Once VS.NET breaks on that line, we can walk through the rest of the code line-by-line, observing exactly what happens. Once you've set your breakpoint, you can attach to the ASP.NET process and walk through your code one line at a time. To attach to the ASP.NET process, use the following steps:
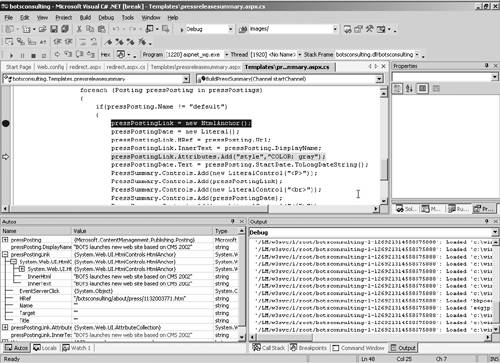
After you've successfully attached to the ASP.NET process, open an Internet Explorer session and browse to your site. In our case, we want to browse to the In the Press section of the site, since the summary posting uses our Press Release Summary template. When we navigate to that section, VS.NET will reappear and break the code execution where we set our breakpoint. When this happens, simply close the Processes dialog and step through your code using the F11 key (step into) or F10 (step over). In Figure 12-18, you can see what this process looks like. Figure 12-18. Stepping through code in VS.NET
In Figure 12-18, in the lower left section of the screen, you can see all the objects that were created as well as all the values of the objects and what system type they are. On the lower right side, you can see all the assemblies that were loaded and their status. In this way, everything that your application is doing is exposed; if a variable is assigned the wrong value or no value at all, you can instantly see that happen as you walk through the code. By far, this is one of the coolest features of VS.NET (it's surprising what excites us, isn't it?). If you've ever had to put in multiple response.write statements in ASP code to see what's going on or had to rely on IIS to tell you what line number failed in your code, you'll appreciate this way of debugging. Using a Redirect PageAs we mentioned earlier, there is another technique for debugging. This technique isn't too radically different from a tracing perspective, but it eliminates the need to attach to the ASP.NET process. The technique is really just creating a redirect page, setting that page as your start page, and using the typical debugging process in VS.NET (pressing F5). The real advantage is that debugging is a bit more "natural." In the BOTS Consulting site, we created a simple redirect page in the root of the solution. We called the page redirect.aspx (hey, we're developers name creativity is not our strong suit). In the ASPX page, we have the following code: private void Page_Load(object sender, System.EventArgs e) { Response.Redirect("http://localhost/botsconsulting/"); } Notice there's nothing overly complicated about the code. It simply redirects to the BOTS Consulting root. To create your redirect page, simply right-click your project (or in whatever folder you wish to place the page), pick Add, and then choose Web Form. This creates a standard ASPX page in your project (you don't have to create a CMS template file). Once the page has been added to your project and you see the Design view, switch to the code-behind and add the redirect code to the Page_Load event. Once you have your redirect page created, simply set it as your start-up page. To set this page to be the start-up ASPX file, right-click the page in your Solution Explorer. From the context menu, pick Set As Start Page (shown in Figure 12-19). Once you've done that, simply press F5, and VS.NET will rebuild your solution, start Internet Explorer, and run your Web application. When the code execution hits a breakpoint, VS.NET will reappear and allow you to step through your code. Figure 12-19. Setting the redirect.aspx page as the start page
|
EAN: 2147483647
Pages: 298