12.3 UML notation
UML notation
UML notation is so rich that its creators had to write three books, rather than one, to describe all its details. And even that wasn't enough, so they edited a whole series of books that are additions to their own books.
It's obvious that this book cannot describe all the details of UML. It's not meant to do that, nor is it meant to compete with the other UML books. I wrote this book to describe object-oriented programming in Visual FoxPro. UML is part of that, so I will describe the aspects of UML that are important for Visual FoxPro programmers.
Packages and package diagrams
Packages are a simple way to break a model down into smaller systems. Remember that we use modeling to design large and complex systems. It would be impossible to model a complex system in one single diagram. Such a huge diagram would only increase confusion and do more damage than good.
Packages categorize diagrams based on logical structures. Packages can contain sub-packages, as well as classes and any other UML elements. They should not be compared with Visual FoxPro class libraries. Classes located in one package can be stored in different Visual FoxPro libraries, and one FoxPro class library can host classes located in different packages. Figure 1 shows a UML package.

Figure 1
. A UML package.Packages can be displayed in regular class diagrams (in combination with other UML elements, that is). Typically, diagrams that contain packages show packages only to avoid confusion and keep everything simple. I like to call these diagrams package diagrams, although this is not a UML term. Package diagrams show packages contained in one view and how they relate to each other. Figure 2 shows a package diagram that has sub-packages of the one displayed in Figure 1.

Figure 2.
A package diagram shows dependencies between packages.This diagram shows the four main packages (categories) into which our movie theater example is broken down. I added a comment that describes the current diagram.
The diagram also shows how the packages relate to each other. The dotted lines are called dependencies. Typically, some descriptive text is added to describe the relation. Usually, they are meant to be read together with the package name. Figure 2 shows that there is a "Schedule for each of the Screens" and the "Reservations depend on the Schedule."
Dependencies between two packages exist if there are relations between any two classes in the involved packages. For example, if any class in the Schedule package depends on another class in the Movie Database package, there is a dependency.
Dependencies have navigability, which means that the arrow must be drawn in a certain direction. In Figure 2, the Schedule depends on the Movie Database but the Movie Database can exist on its own.
There are some packages that almost every other package depends on. We'd create a mess if we drew a dependency from every package to one of these. For this reason, UML allows us to define packages as global, which is displayed with a remark in the actual package item (see Figure 3).
Using Rational Rose or Visual Modeler, you can define a package as global in the package specification. You can get to this specification by selecting Specification from the shortcut menu. The actual setting can be found on the Detail page, shown in Figure 4.

Figure 3
. A global package.

Figure 4.
Defining global packages in Rational Rose.What happens to sub-packages? Some say that a dependency on a package does not automatically mean that there is a dependency on sub-packages. In this case, you'd have to draw the dependency to the sub-package in a separate diagram or add the sub-package to the current one. UML diagrams can contain elements that are located in other packages (see Figure 5).
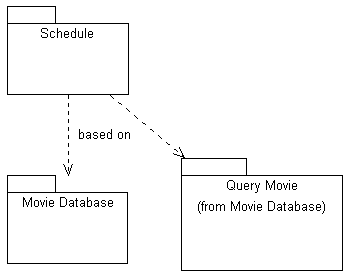
Figure 5
. Items can show up in more than one diagram, even if the diagrambelongs to a different package.
The package now has a comment indicating that it doesn't belong to the current package. However, this seems to complicate the diagram without adding any real value. For this reason, I suggest treating this a little differently. Many argue that package dependencies are "transparent," which means that all sub-packages are automatically related to all packages on which the parent package depends.
UML does not define whether or not package dependencies are transparent. You have two choices. First, you can assume that it is either one way or the other and not worry about it anymore. This is perfectly fine, as long as the model isn't discussed with somebody who assumes differently. Secondly, you can use UML stereotypes, which allow you to define things that UML doesn't deal with. I'll discuss stereotypes a little later.
In the Rational Rose browser, packages are displayed as folders, as shown in Figure 6.
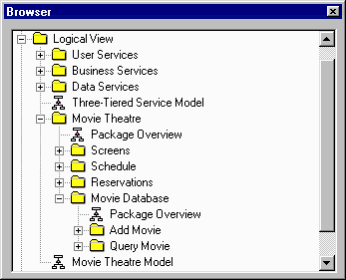
Figure 6
. Packages displayed in the Rational Rose browser.There is nothing like packages or dependencies in Visual FoxPro. Nevertheless, they are important for FoxPro programmers to understand, because they are the basic tools that help to get an overview of the whole application.
Use Case diagrams
Use Cases
are created during analysis. In fact, they are a big part of analysis so I will discuss them in great detail in Chapter 14. However, I still want to briefly summarize use case notations.Ivar Jacobson first introduced use cases. Typically they contain a lot of text and therefore are not loaded with a lot of special notation. The typical tool to create use cases is a text processor like Microsoft Word. In addition, you can use Rational Rose to coordinate use cases and the parties involved (actors). Visual Modeler does not support use cases.
Actors
Actors
are not part of the system. They represent anyone or anything that interacts with the system. An actor might be a user who pushes the mouse, or another system or object that uses the described one. The UML symbol for actors is rather simple (see Figure 7).
Figure 7
. The UML symbol for actors.Well, as I said before: Simplicity is important
I personally don't care for this notation. It seems to suggest that actors are always human users, but quite the opposite is true actors are more often objects than people. But this statement is based on my own experience; you might find it totally wrong. Just keep in mind that actors are not necessarily human beings.
Use cases
The UML element used to represent use cases should not be confused with the descriptive use case created in a word processor. The descriptive kind of use case can be attached to a use case element in a UML diagram (see below). Figure 8 shows what a use case looks like in UML.

Figure 8
. The UML notation for use cases.This notation is typically used to give an overview of all use cases that describe the system and the actors that use it. When using Rational Rose, you can attach files (such as Word documents) to these use cases.
Use case diagrams
Use case diagrams describe how different use cases relate to each other, depend on each other or extend each other. Figure 9 shows a part of the movie theater example.
One of the actors in Figure 9 is the Movie Master a human user who updates and maintains the movie database on which the theater relies. Based on this diagram, we know that there is a use case that describes how a movie is added. Obviously it doesn't describe all the details, but it uses the use cases "Add Record" and "Check if Movie exists" to describe these general tasks. At the same time, the "Add a Reservation" use case also uses "Check if Movie exists." The actor involved in this use case is not human. It's some mechanism that deals with Web hits maybe an ISAPI application or something similar.
The details about each use case (which are usually several pages each) are not located in this diagram. They are in documents that can be attached to each element of the diagram, if you use Rational Rose.
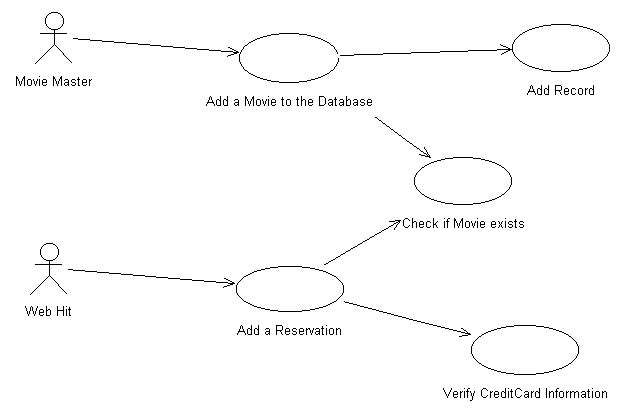
Figure 9
. A use case diagram.Class diagrams
Class diagrams play a vital role in all modeling methodologies. They show classes, dependencies and inheritance relations. Typically, the largest part of an object model is its class diagrams. To deal with all this information, there are many different UML items and special notations. For this reason, I split the description of class diagrams into two: the basics and more advanced elements.
Class diagram basics
Typically you'll be fine using only the basics. Once you are more familiar with these ideas, you'll be able to discover the value of specialized notation as described in the "Advanced class diagrams" section.
Classes
The basic element of a class diagram is the class itself. In its simplest form, it's a rectangle with a name (see Figure 10).

Figure 10
. A simple class in UML notation.This simple notation is useful in large scenarios that show many different classes. It doesn't provide detailed information about the class, but UML allows you to display more information, as shown in Figure 11.
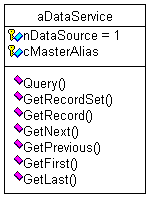
Figure 11
. A more complex class.This class has two properties and seven methods. The key icon indicates that the properties are protected. The Visual Studio method icon indicates that the methods are all visible to the public. The visibility of methods and properties can also be private (hidden) and implementation.
These classes, properties and methods can be translated directly into Visual FoxPro properties and methods. Visual FoxPro does not support the visibility "implementation," which is the only limitation to be aware of.
Visual Modeler and Rational Rose make it very easy to add classes to a model. You simply drop the class icon from the toolbar into a diagram, and the class is added to the current package. To add properties and methods, right-click on the class and select New Property or New Method from the shortcut menu. To change the visibility of a member, simply click the icon to the left of its name. This brings up a menu that offers the four different options I described above. For those who want more detailed information about the class, you can refer to the Class Specification dialog. To open it, either double-click the class or select Open Specification from the shortcut menu (see Figure 12).
The General page shows general class information such as the name and the stereotype (see below), as well as the verbal class documentation. It also shows the parent of the current class. In Figure 12, the class doesn't have a parent class, so the dialog displays the package this class belongs to (Data Access).
The Methods and Properties pages show more details about the properties and methods belonging to that class, in addition to all inherited ones (optional). Figure 13 shows the Methods page.
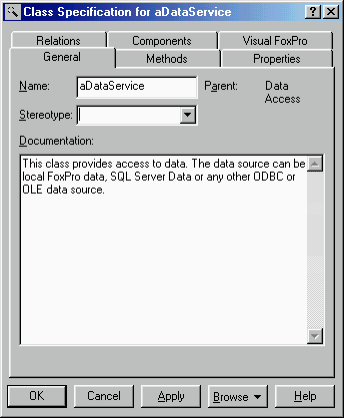
Figure 12
. Rational Rose's Class Specification dialog.
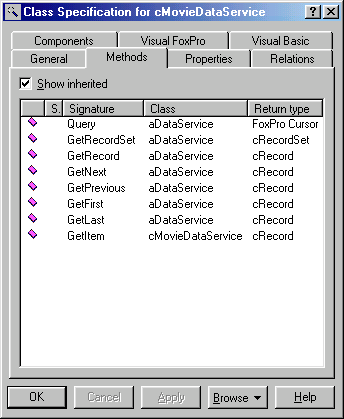
Figure 13
. Inherited and newly defined methods of a class in Rational Rose.This page has a complete list of all methods belonging to the class. It explains the method's visibility, its stereotype (see below), its name, the class it belongs to (which is important if inherited methods are displayed) and its return type. The Properties page is much like the Methods page (see Figure 14).
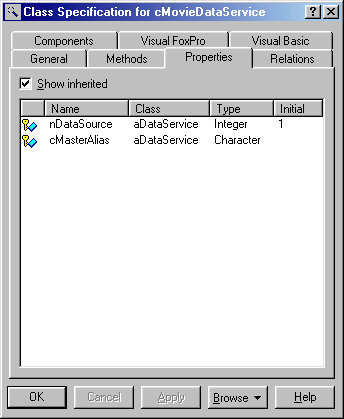
Figure 14
. Class properties in Rational Rose.Properties do not have a stereotype. Of course, they do have a type and they can also have an initial value.
Each property and method also has a specification dialog of its own, where you can define types, parameters and stereotypes. The Method Specification dialog's General page doesn't hold many surprises. It allows you to define the name, type, stereotype, visibility and the method's documentation. The Argument page is a little more exciting. It specifies the parameters and types that can be passed to the method (see Figure 15).
There is no parameter-specification dialog. You can simply enter all parameters directly into the grid. Unfortunately, there is no way to specify whether a parameter is optional.
The Property Specification dialog is rather simple. It looks a lot like the Method Specification dialog without the Argument page. The only difference is that it also allows you to specify an initial value.
Many of these dialog settings can also be displayed in the UML class diagram, as shown in Figure 16.
I don't like the UML class diagram much. I think diagrams become cluttered if they show too much information that detracts from the main information. For this reason I activate the display of that information only in very small scenarios.
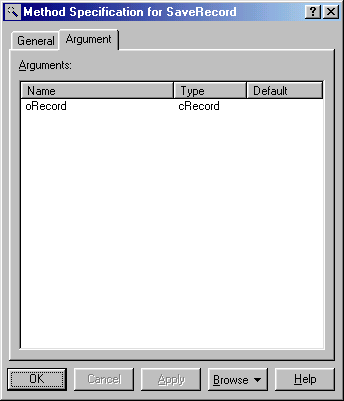
Figure 15
. Defining parameters for a method.
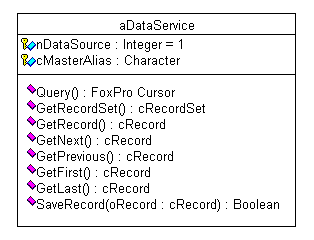
Figure 16
. A UML class showing properties and methods as well asparameters and initial values.
Classes and their dependencies
Now that you know how classes are displayed, you can examine their dependencies and relationships. Figure 17 shows a simple class diagram that illustrates how the objects that form our movie database application work together.
We have two forms (cMovieList and cMovieEditForm) that are subclassed from the class cDocumentForm. This is just like an Is-A relationship in Visual FoxPro (inheritance/subclassing). This class belongs to another package and is displayed in this diagram only for documentation issues.
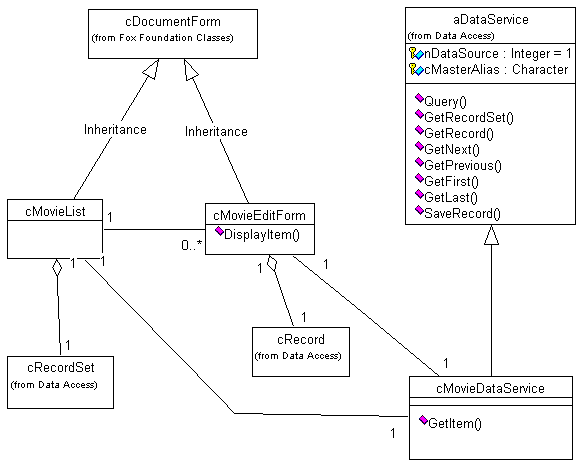
Figure 17
. A class diagram.The line between the two form classes is called an association. It tells us that these two classes know about each other. Perhaps they depend on each other or they exchange messages we can't tell by this diagram. A sequence diagram (see below) would clarify the situation. The diagram specifies that one cMovieList class can communicate with "zero or more" cMovieEditForm classes. However, each edit form class can deal with only one specific list. The numbers at both ends of the association are called "the relation's multiplicity." There is no such thing as an association in Visual FoxPro. Nevertheless, it makes a lot of sense to use associations in the design because they clarify which classes know about each other.
Both form classes communicate with the cMovieDataService class to retrieve data. This class is a subclass of aDataService, which also belongs to another package. The data service retrieves data in an objectified fashion. It retrieves either a single record object or a whole record set. In Visual FoxPro, these objects could be created using the SCATTER NAME command. In the movie theater model, these objects are attached to each form class. The diagram also specifies the object ownership. The record object as well as the record set is owned by each form. If the form is released, the record and record-set objects will be released as well. This is indicated by the diamond sign at the owner-end of the line. This kind of relationship is called aggregation.
This diagram hides a lot of information. It does not show that both the cRecord and the cRecordSet classes have associations to the data service. Neither does it explain that the cRecordSet class owns many instances of cRecord. A different, more generic diagram provides this information. Adding too much information (especially information that's provided elsewhere and therefore redundant) doesn't add value to the model it just makes the diagrams harder to read. In fact, the diagram above holds information we don't really need. The fact that the specialized data service is a subclass of the abstract one, or that the form classes are subclasses of a general form, can be explained elsewhere. Even if we want to show these classes in the current diagram, we probably don't have to show all the inherited properties and methods unless they are crucial to the documented scenario.
Figure 18 shows the same scenario as the more complex Figure 17. However, it assumes that details are explained in another diagram. Therefore, it doesn't replace the first diagram, but it's a valuable addition that provides a simple overview.
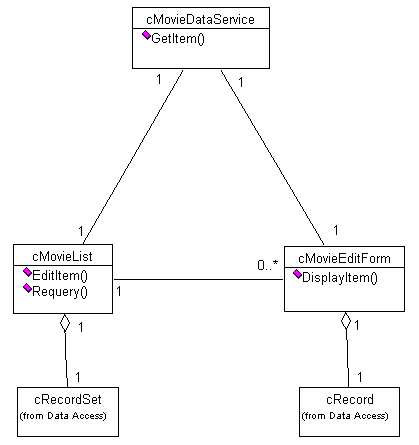
Figure 18
. The simplified version of the class diagram in Figure 17.Simplicity must be one of the main targets when creating object models. During the project life cycle, you won't get another chance to display scenarios as simply and easy to understand as in class diagrams (and other diagrams of the model).
Generalization
Object modelers use the term generalization instead of inheritance. This is based on the fact that a parent class is a more general version of the subclass. The notation for inheritance (generalization) is an arrow that points from the subclass to the parent class.
Because UML is not specific to any implementation language, it has to support all mechanisms that are supported by any of these languages. That also means that UML can handle multiple inheritance (see Figure 19).
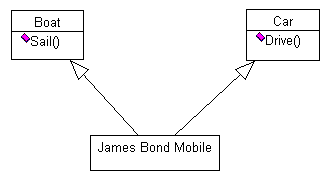
Figure 19
. Multiple inheritance, the big no-no in Visual FoxPro.As I've already mentioned, Visual FoxPro doesn't support multiple inheritance. For this reason you should never create something that looks like Figure 19 if you want to use it for Visual FoxPro. Repeat after me: "I will not design multiple inheritance! I will not design multiple inheritance!" Good!
Association
An association is a relationship between two classes. There is nothing in Visual FoxPro that represents the same kind of animal as an association. Object references could be seen as such; late composition is similar, too.
Nevertheless, associations are valuable tools when creating an object model. At an early stage in the modeling cycle, associations are very general. Later on, they are more specific. Associations can change into aggregation relationships. Typically, associations get navigability, which means they might not necessarily work both ways. One object might know about another that doesn't have a clue it's been watched or used. In fact, this seems to be the rule rather than the exception. Take Visual FoxPro forms, for example. They are well aware of all their members, but the members should be very generic. Therefore, they do not know about the forms they live in.
Sometimes associations also become generalizations (inheritance relations). This usually happens very early in the cycle; otherwise it requires some redesign. The reasons for changing an association into a generalization can be different. You might discover that two associated objects don't have much unique behavior but cover similar topics. In this case you might combine them into one class. To keep changes minimal, you'd create subclasses of this class in order to provide the previously defined interface. Everything defined later in the cycle can use that new class, and eventually, when everything is cleaned up, the subclasses can be removed and all classes in the system will use the new class that combines the two original classes. In other scenarios, you might discover that a class needs the entire functionality of another class rather than just the ability to send a couple messages to it. In this case, you'd make the class that needs the whole functionality a subclass of the more general one that shouldn't be changed or polluted with the methods and properties of the specialized one.
Aggregation
Aggregation seems simple a car has an engine, a form has buttons, and so forth. Unfortunately, it's more complicated than that. The example with the cRecord class demonstrates this quite well. Does the record really belong to the form? Maybe not. It could just as well be handed over to another object that will take care of that record. In this case, we'd be talking about an association rather than aggregation.
Well, I'm not ashamed to admit that I get confused every now and then myself. Even gurus like The Three Amigos can't agree on the same issues in certain instances. If worse comes to worst, I go back and redesign my model. Not exactly a fun thing to do, but hey everybody has to bite the sour apple from time to time.
There is also a specialized kind of aggregation called composition. It is usually drawn much like a regular aggregation but with a filled diamond (see Figure 20).
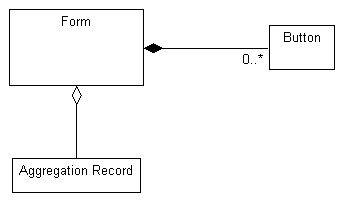
Figure 20
. Aggregation and composition.It's easy to tell that the button is contained in the form, and therefore owned by the form. In UML, this is called aggregation by value. The record object, on the other hand, does not belong to that form. It can use it as long as needed, but other objects can also access it. Furthermore, when the form is released, the record can remain in memory if required. It's pretty much an independent object that just happens to serve the form class. This is called aggregation by reference.
Aggregation can be translated into Visual FoxPro easily. Every kind of containership is aggregation by value. Objects that are tied together using object references demonstrate examples of aggregation by reference. Quite simple, isn't it?
Often people ask me why aggregation can't be imported to Visual FoxPro by the connection wizards. The answer is rather simple: Aggregation in modeling is at a higher abstraction level than composition in FoxPro. They are actually "incompatible." Consider Figure 21.
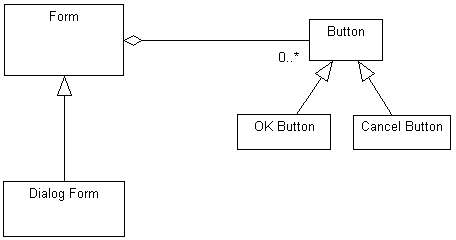
Figure 21
. Two form classes that may or may not contain buttons of various types.This simple diagram would be impossible to translate into FoxPro code. We basically know that the Form class can contain "zero or more" buttons. This by itself is vague from an implementation point of view, while it's perfectly fine for the model. It gets even worse than that! Figure 21 also tells us that all subclasses of the Form class could contain an undefined number of instances of the Button class or one of its subclasses.
Now imagine how this would work when you "round-trip" your model. The diagram has to be converted into FoxPro code, the programmer works on it for a while and updates the model with the changes he's made. In this case, the wizard had to analyze the Dialog Form class (for instance) and count the buttons. At that point, it had to figure out whether or not one of the parent classes of the button already was specified as a member of the class or of any parent classes. If so, it had to be smart enough to understand whether or not this relation already described the fact that the button is in the Dialog Form. There are a couple of problems here. First of all, scenarios get "slightly" more complex than the one above. Also, understanding a model is not trivial. The wizard would need to have full knowledge of the entire UML specification, including stereotypes and other equally complex ideas. Furthermore, it would have to understand the process applied by the modeler. And even if it knew all of that, the modeler might have altered a couple of things just a little bit, which would result in a scenario the wizards couldn't handle. The risks of misanalyzing a model and breaking it while updating changes are far too great.
Dependencies and instantiation
Objects often depend on each other. In class diagrams, this is indicated by a dotted line, just as in package diagrams (see Figure 22).
This example shows not only which objects depend on each other, but also which classes create (instantiate) others. This is very important to know. In this example, the cMovieList class depends on the cMovieDataService, but it doesn't create it. The application object takes care of that. I simply use the description to indicate whether or not a dependency also means instantiation.
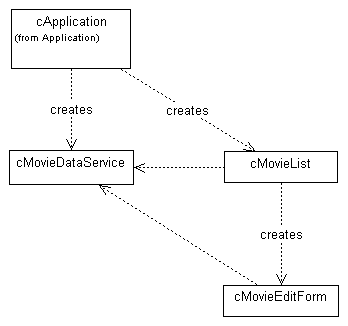
Figure 22
. Objects and their dependencies.Multiplicity
I have used the term multiplicity in several examples. It can be attached to many kinds of relations, and it deals with the fact that one class can be instantiated several times.
When using aggregation, one class can contain many instances of another class or one single, specific instance. A car, for example, has one and only one engine. A plane, on the other hand, might have zero or more engines depending on its type. While a glider doesn't have an engine at all, a large passenger plane might have three, four, or more engines. This information is important for the design of the plane.
It's just as important to know how many instances of an object are involved in a certain relationship. UML allows you to indicate this using numbers at each end of a relation. Figure 23 shows an example.
This demo shows a form class (EditForm) that may or may not contain some buttons (zero or more). We do know that it contains one, and only one, Save button. The form depends on some data service. We can tell by this diagram that many forms depend on the same service object. Each of these service objects can deal with an undefined number (zero or more) of record objects.
Now imagine this diagram without the multiplicity information. It wouldn't tell you a whole lot, would it?
Relations at a glance
When using Rational Rose, there is a simple way to see all relations of a class. The Relations tab of the Class Specification dialog contains this information (see Figure 24).
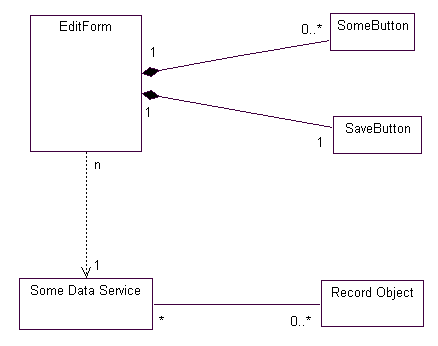
Figure 23
. The EditForm class contains one Save button and optionally anunspecified number of other buttons.
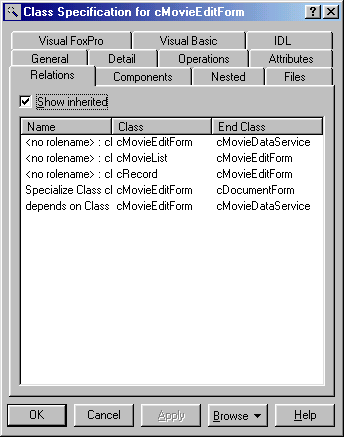
Figure 24
. Rational Rose shows relations to other classes.This page can get cluttered because it shows all kinds of relations in one list. Nevertheless, it holds valuable information. It is easy to spot classes that might be hard to reuse because they are involved in many relations. It is also easy to see what classes might be influenced by changes in the current class. And if a class is to be reused, this page holds all the information about classes that have to go with it. To get more information about a certain relation, just double-click an item in the list.
I found this information to be some of the most valuable in the whole product. It's the information I use most when going back to a model that has already been implemented but needs to be changed or maintained. Often I have to make changes to projects that are not my own, and it's difficult to know what parts of the system might be influenced by those changes. The relationship information clarifies this. I sometimes also have problems with my own projects. Who can ever remember what classes have to be brought over to another system when reusing code? This dialog helps a great deal with all these issues.
Advanced class diagrams
By now you are familiar with the most important class diagram concepts. However, you may have encountered scenarios you couldn't model to your total satisfaction. This might be due to the fact that you don't know all the details yet, or you simply try to do something the UML can't handle. For all those cases, I can offer you solutions.
Interfaces and abstract classes
Interfaces and abstract classes have the same meaning in object modeling as in Visual FoxPro. An abstract class will never be instantiated directly, but its subclasses will. An interface class is a special case of an abstract class. Its only purpose is to define the interface of its subclasses. An interface class does not have any behavior (code) attached; the behavior will be added in the subclasses. Figure 25 shows how we could model the abstract screen class used as an example in previous chapters.
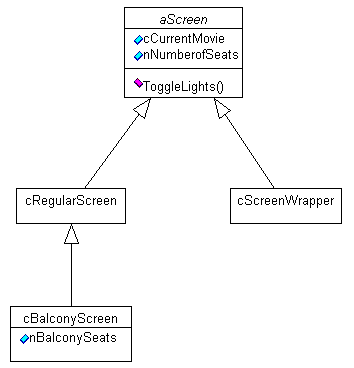
Figure 25
. aScreen is an abstract class in this diagram.The abstract class is indicated by the italic font style of its name. When drawing this on a whiteboard, it might be hard to illustrate italic fonts. In this case you can add "{abstract}" after the name of the class.
Interface classes are just a special case of abstract classes. Often you won't really know whether a class is abstract or an interface. For FoxPro programmers, it doesn't really matter. However, if you want to define a class as an interface class, you can use the interface stereotype (see Figure 26). See below for more information about stereotypes.
Actors
Actors can be used in class diagrams as well. However, most scenarios documented in class diagrams don't need actors. Actors typically deal with objects rather than classes, but in some rare instances they might come in handy. See the section "Use Case diagrams" for more information about actors.
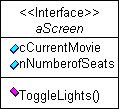
Figure 26
. A class using a stereotype.Derived attributes
Derived attributes are those that can be calculated from other attributes. If you know the birthdate of a person, you can calculate the person's age. Therefore, the age would be a derived attribute. If we want to reuse our movie theater example, it might be handy to use derived attributes for the reservation class (see Figure 27).
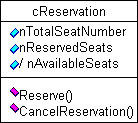
Figure 27
. nAvailableSeats is a derived property.The attribute nAvailableSeats is derived, which is indicated by the slash in front of its name. Unfortunately, this is not obvious and it's hard to see, especially in combination with the Visual Studio property icon. On the other hand, whether or not a property is derived is close to being an implementation issue. Therefore, it should not clutter the design too much.
In Visual FoxPro, derived properties can be implemented using access and assign methods. Instead of returning the property value, you calculate the requested value and bypass the accessed property. Here's some sample code:
FUNCTION nAvailableSeats_access
RETURN THIS.nTotalSeatNumber THIS.nReservedSeats
ENDFUNC
FUNCTION nAvailableSeats_assign
LPARAMETERS lvNewValue
ERROR 1743 && We fake a regular FoxPro error
ENDFUNC
Association classes
Association classes allow you to add objects, methods and operations to associations. In Figure 28, a customer is associated to a screen. The association involves a reservation record that has more information about that association.

Figure 28
. Use of an association class.Diagrams like this are highly abstract. Figure 28 is a simplified version of Figure 29.

Figure 29
. The same scenario as in Figure 28 without an association class.Simplicity is one of the greatest powers you can give to an object model. The version that uses the association class is a lot easier to read (at least for those who are familiar with the concept).
Each association can have only one association class. If you need more than one association class, you have to turn them into regular classes. In this case you lose the advantage of the simpler notation.
Due to the high level of abstraction, association classes are specific to the modeling tool. In Visual FoxPro, you'd probably write a lot of code to create the described scenario. Especially for this reason, this notation is very valuable.
When to use class diagrams
Class diagrams are the core of every object modeling methodology, which is also true for UML. You'll find yourself using class diagrams more often than every other UML diagram.
The great danger is to overuse the notation and to clutter your diagrams. Keep in mind that the greatest advantage of class diagrams is their simplicity. Try to keep only the most crucial information in each scenario, and don't use all the available notations at once. If in doubt, create two different diagrams documenting different areas of the scenario, rather than drawing one huge diagram that's difficult to understand.
Class diagrams that are kept simple are fairly easy to understand, which makes them good candidates for meetings and demonstrations.
Interaction diagrams
Interaction diagrams describe how objects work together. They typically show a small scenario, usually based on a single use case. The diagrams show a couple example objects and how they communicate with each other. The diagram may or may not specify the classes that make up these objects.
There are two kinds of interaction diagrams: sequence and collaboration.
Sequence diagrams
These diagrams are one of my personal favorites. They show objects and the messages they sent, and describe the timeline they follow.
Objects are rectangles aligned from left to right at the top of the diagram. Attached to each one is a dotted line that represents time. This line is also called the object's lifeline. Messages are represented by arrows between the lifelines. They usually have some descriptive text attached, normally the name of the method that is called. Sometimes parameters or other issues are described there as well. Arrows can point from an object back to itself, which would represent a message an object sends to itself.
Figure 30 shows a simple sequence diagram, which shows how the user can edit an existing movie that's stored in the movie database. It shows the human user like another object in the diagram. When the user wants to edit an item (by double-clicking in a grid, for instance), the EditItem() method of the MovieList object is called. This method then makes a call to a special EditForm object. It is not specified whether this object is created by the list object or already exists. The EditItem() method sends a DisplayItem() message to the edit form, which causes this object to retrieve an item from a data service object and to refresh itself in order to display the correct item. Afterwards, this sequence of messages is over, which is indicated by the rectangles attached to the lifeline of the objects. They inform us about the runtime of each message or method. At the end of each rectangle, the method is finished.
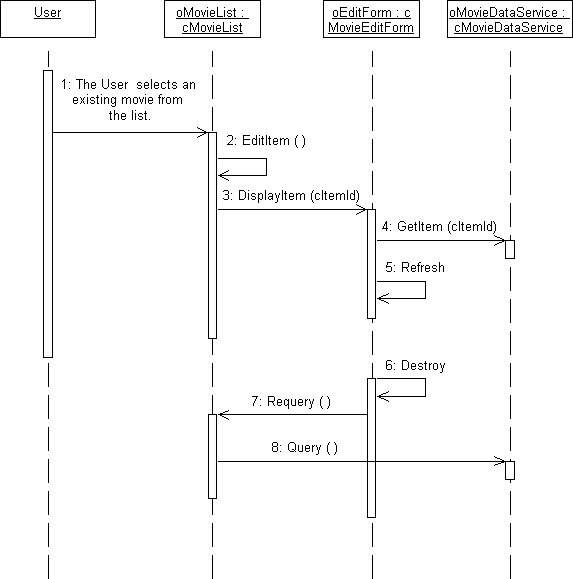
Figure 30
. A sequence diagram.There is more information in this diagram. It also tells us that the Edit Form sends a Requery() message to the list form to make sure all the contents are displayed properly. The list form uses the data services Query() method to retrieve an updated set of records.
This diagram is already rather specific to Visual FoxPro because it takes care of the fact that you need to issue a refresh to make sure all data is displayed properly. That's what we call an implementation issue that shouldn't really show up in the design. Implementation issues are concerned with special behavior in the implementation environment. The fact that Visual FoxPro doesn't necessary update all its fields when retrieving new data wouldn't be of concern if we'd implement the scenario in a different language. Also, workarounds or performance issues should not show up in the design.
However, the fact that the edit form sends a Requery() message to the list form is not FoxPro specific. That's how we designed our system. Imagine what would happen if the application ran against a SQL Server back end. No matter what language we used, we'd have to requery the data displayed in the list.
There are two bits of control information you can add to a method arrow. The first one is a condition, which has to be checked before the method is executed. Figure 31 shows an example the list form is updated only if changes were made in the edit form. If no information changed, updating the list form would be a waste of time.
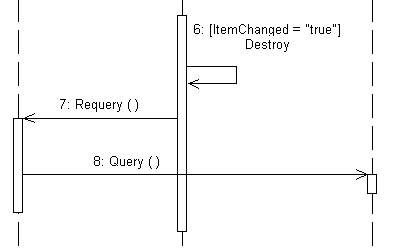
Figure 31
. Preconditions in a sequence diagram.The second bit of control information is the iteration indicator (*). Figure 32 deals with the fact that the list could allow multi-select, and therefore an edit form would have to be opened for each selected item.
Sequence diagrams can also be used to document where values are returned from a method. Some people think that a Return should be drawn at the end of every method, as in Figure 33.
I don't often use return arrows. They look a lot like regular messages, which confuses me. After all, it's easy to see where a method ends, since the bar ends right there. I add an arrow for Return only when something special is returned such as a particular item in Figure 33.
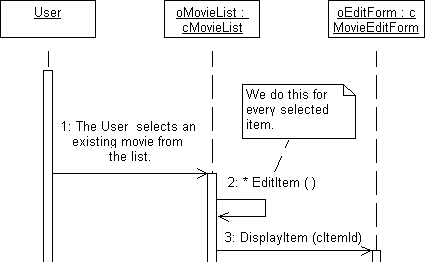
Figure 32
. The asterisk (*) indicates iteration.
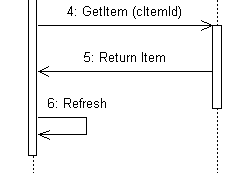
Figure 33
. Return values documented in a sequence diagram.
One issue I consider very important is to indicate where objects get created. Unfortunately, there is no special notation that allows you to document that important event. I use a regular arrow labeled with the keyword "new" to signal that an object is created in this step (see Figure 34).
Sequence diagrams are easy to read and understand. They show object interaction in an orderly fashion, which is a great strength. One of the hardest things to understand in object-oriented projects is the overall flow of control. Sequence diagrams help to illustrate that.
When using Rational Rose (Visual Modeler doesn't support sequence diagrams), message trace diagrams (the old term for sequence diagrams) are also of great help when it comes to discovering gray areas of the system and adding new methods. When you specify a class for the used objects, you can right-click on a message arrow and select one of the existing methods. This makes it obvious when methods are missing. Rose allows you to add these methods to the classes right in the sequence diagram. This is a great feature, and I use it to discover most of my methods. This feature alone makes it worth the upgrade from Visual Modeler to Rational Rose.
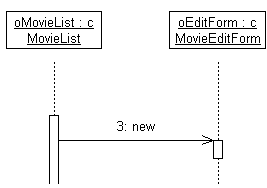
Figure 34
. Object instantiation indicated in a sequence diagram.When to use sequence diagrams
For me, sequence diagrams are the second most important diagrams (after class diagrams). They have several different uses, one of which might be to demonstrate object interaction within a specific use case. Another would be to document the behavior of a few objects after triggering an action such as sending a message. In this case, sequence diagrams show very well what messages are sent when to what object.
I often use sequence diagrams to discover methods. I simply drop objects of a specific class onto the diagram and start to model the actions that take place. This way I can discover missing methods very quickly.
Sequence diagrams always document interactions based on a timeline. If you want a more general overview that shows a larger scenario possibly across different use cases use activity diagrams instead. If you want to track one specific object in a generic fashion and in large scale, consider state diagrams.
Sequence diagrams are easy to read. The basics can be explained within a couple of minutes. For this reason I like to use them in meetings and demonstrations.
Collaboration diagrams
Collaboration diagrams
are also concerned with object interaction. They use numbering to indicate the message sequence, rather than lifelines. This makes the timing much harder to read than in sequence diagrams, but collaboration diagrams display other things much easier. Figure 35 shows an example of the same scenario I used in the sequence diagram.As you can see, the collaboration diagram makes it easier to see which objects communicate with each other and how they are statically connected. At the same time it's a lot easier to see the message-firing sequence. The runtime of each method cannot be determined easily by this diagram because there is no optical clue where a method ends unless it has a return value. Of course, the method runtime could be determined in most cases by carefully analyzing the diagram, but it's much easier to use sequence diagrams instead.
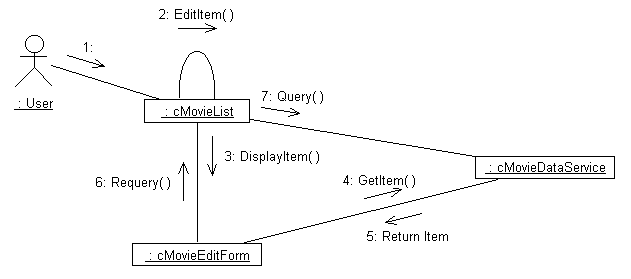
Figure 35
. A collaboration diagram.Whether you use collaboration or sequence diagrams will depend on the scenario you model and what you are trying to show. In addition, personal opinion will influence your decision. I prefer sequence diagrams in most cases because I like to see what happens in what order, but as you can see in Figure 35, collaboration diagrams tend to be smaller and therefore appear simpler. Simplicity is good. Typically I will create both diagrams. The collaboration diagram provides a quick overview, and if I need details I can always go to the sequence diagram. For this reason, I don't put a lot of detail in collaboration diagrams. If you examine Figure 35 more closely, you'll see that I didn't bother to add object creation or conditional messaging, even though these features are supported by collaboration diagrams.
When to use collaboration diagrams
Use collaboration diagrams when you want to get a quick overview of the general flow of events and object relations. Do not use them when you want to get a good idea of timing or message sequencing. You might also find these diagrams useful for larger scenarios, because sequence diagrams tend to be huge.
Component diagrams
Component diagrams define how classes should be grouped together in the implementation. Typically, but not necessarily, all classes of one package go into one component. Figure 36 shows a simple component diagram for the theater example.
In languages like C++, all classes in one component would go in one header and one CPP file. In Visual FoxPro, the classes of one component would be stored in one class library, which could be either a VCX or a PRG file. Sometimes it's also handy to assume a component is just like an Automation Server. You can specify that using a stereotype.
Rational Rose makes it easy to assign classes to a component. You simply drag and drop from the browser to the component in a diagram. All assigned classes are then displayed selected in the Realizes tab of the Component Specification dialog (see Figure 37).
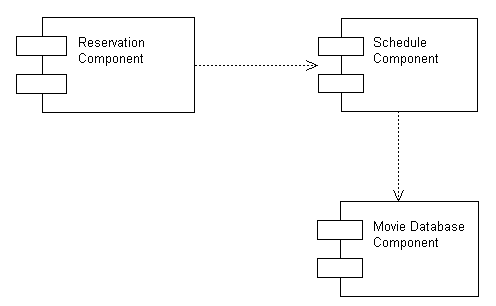
Figure 36
. A component diagram.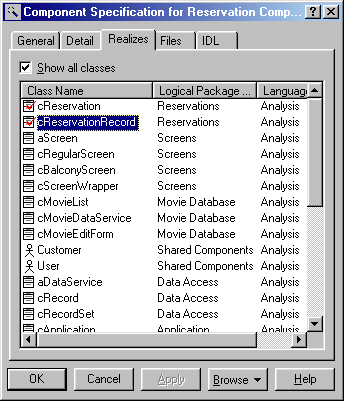
Figure 37
. Adding classes to components.The Component Specification dialog shows all classes that have been created in the model. The ones assigned to the current component show a red checkmark, like the first two items in Figure 37. Classes can be assigned to components by selecting Assign from the shortcut menu. A class can be part of more than one component. The Class Specification dialog has a Components page as well (see Figure 38).
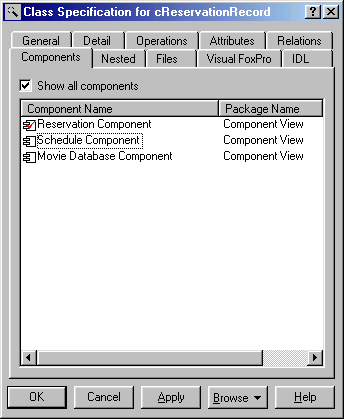
Figure 38
. Component specifications for classes.You can also assign classes to components from this dialog.
When to use component diagrams
Use component diagrams to specify how an application can be broken down. Often components are later associated with certain devices in deployment diagrams.
Component diagrams are also used to specify where classes should be stored when using source code generation tools. However, the Visual FoxPro Modeling Wizards support other ways of doing that, as I will describe in later chapters.
Deployment diagrams
Deployment diagrams describe how the application will be deployed, possibly across several computers using different connections and protocols. Figure 39 shows how we plan to deploy our movie theater application.
Typically there are only one or two deployment diagrams per model, if they are used at all. I have to admit that I don't ever use them myself, and I've hardly ever seen them used by others. But I expect that they become more and more important when more large-scale Internet applications are created, or when people start to use technologies like Microsoft Transaction Server or DCOM on a more frequent basis.
When to use deployment diagrams
Use deployment diagrams when you create an application that is not just one single EXE that runs on a single computer. I've found that deployment diagrams are only of value when I'm doing something new that I have to demonstrate to other team members or to upper management. I wouldn't bother making a deployment diagram when creating a simple network application with a data server and a couple of workstations.
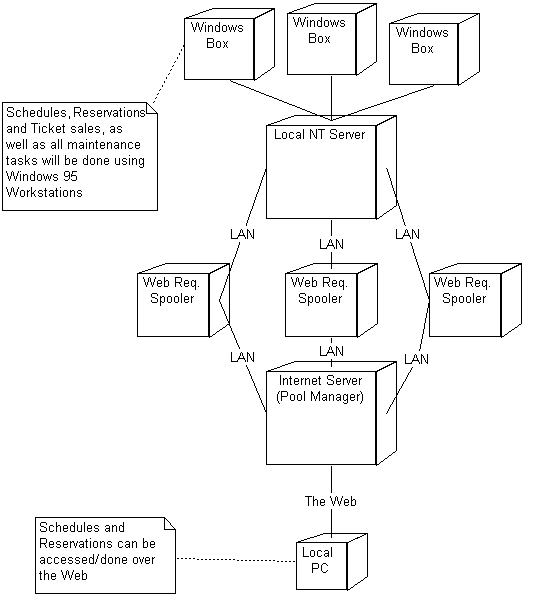
Figure 39
. A deployment diagram.Stereotypes
Rebecca Wirfs-Brock first introduced stereotypes, which have been added enthusiastically to UML. UML stereotypes are somewhat different than those originally introduced, but the basic idea is the same.
The original idea was to provide a high-level classification of an object that gave an indication of the kind of object it was. The Three Amigos reused that idea and turned it into a general mechanism to extend and customize UML. In fact, this became a very important UML mechanism because it guaranteed that UML could satisfy all needs, even if the creators didn't think about certain issues.
UML stereotypes allow controlled extension of the internal UML elements. They build an additional layer at the root of the UML metamodel. In theory, the whole UML could have been built of Things and Stereotypes. Stereotyping the class Thing could derive all other elements used in the language. I like to compare stereotypes to regular classes. Instead of using a native UML element, you take care of your needs by subclassing existing elements. This would have been confusing, though. Imagine modeling classes using classes. For this reason, the special term "stereotype" is used.
Typically, stereotypes are indicated by the special << >> naming convention. Figure 40 shows an example of a stereotyped class.
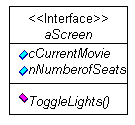
Figure 40
. Use of a stereotype for a class.By the special naming convention you know right away that this is an interface class. You can even go a step further and define your own icons for the stereotypes you create. When using tools like Rational Rose, this is not trivial because the tool itself has to be extended. Rose comes with detailed documentation that explains how to do that, but it's still not simple. I have to admit that I've never done it myself. I found the naming convention to serve my needs well.
Stereotypes can be used for almost any UML element. You could create special dependencies, for instance, such as a "Relation" and a "Table" stereotype that could be used to model relational databases in UML. The possibilities seem to be never-ending
EAN: 2147483647
Pages: 113