9.3 Monitoring
|
| < Day Day Up > |
|
9.3 Monitoring
In this section we briefly describe some monitoring tools which Linux or z/VM systems programmers might use to manage the Linux servers where Domino is running. For more information, we have included references to several other IBM Redbooks. In addition, you can find more information about monitoring the Domino servers with Domino tools and functions in Chapter 8, "Domino administration" on page 169.
9.3.1 Linux tools
There are standard tools that come with the Linux system, as well as tools available from IBM and third-party vendors, that can be used to monitor your system and check the status of the Domino server. In this section, we describe some of tools (top, vmstat, sar, ps, and ipcs) that come with the United Linux 1.0 system distribution.
Top
The top command gives you a comprehensive look at what your Linux system is doing. It shows a table of active processes that is continually updated. The processes using the most CPU are displayed at the head of the list.
Top lets you interactively send signals to, or kill, individual processes. Its behavior, including update intervals and sorting order, can be adjusted, either interactively or by using startup options.
To run top, enter top. The resulting screen (Example 9-4) shows you the current time, how long the Linux server has been up, how many users are logged in, and how many processes are running. You also see how memory and swap space are being used.
Example 9-4: The top command
10:19am up 18:41, 9 users, load average: 1.43, 1.83, 2.36 246 processes: 242 sleeping, 4 running, 0 zombie, 0 stopped CPU0 states: 15.0% user, 6.1% system, 0.0% nice, 78.5% idle CPU1 states: 11.3% user, 28.2% system, 0.0% nice, 60.0% idle Mem: 255220K av, 252240K used, 2980K free, 0K shrd, 1896K buff Swap: 247760K av, 90428K used, 157332K free 198460K cached PID USER PRI NI SIZE RSS SHARE STAT %CPU %MEM TIME COMMAND 29036 domserva 15 0 99660 94M 95720 S 21.9 37.8 6:38 compact 17 domserva 21 0 1168 1168 840 R 21.0 0.4 0:22 top 32633 domserva 15 0 8972 6832 1240 S 3.6 2.6 0:23 java 26557 domserva 15 0 8972 6832 1240 S 3.4 2.6 2:03 java 8 root 15 0 0 0 0 SW 1.7 0.0 3:00 kswapd 6 root 34 19 0 0 0 SWN 1.1 0.0 1:12 ksoftirqd_CPU0 26536 domserva 15 0 8972 6832 1240 S 0.7 2.6 0:32 java 27163 domserva 15 0 41964 34M 33012 S 0.4 13.6 0:00 server 7 root 34 19 0 0 0 SWN 0.3 0.0 3:33 ksoftirqd_CPU1 27222 domserva 15 0 67596 63M 64004 S 0.3 25.2 0:04 sched 27113 domserva 15 0 41964 34M 33012 S 0.1 13.6 0:00 server 28611 domserva 15 0 48472 44M 45260 S 0.1 17.8 0:00 cldbdir 1 root 15 0 76 60 36 S 0.0 0.0 0:01 init 2 root 0K 0 0 0 0 SW 0.0 0.0 0:00 migration_CPU0 3 root 0K 0 0 0 0 SW 0.0 0.0 0:00 migration_CPU1 4 root 25 0 0 0 0 SW 0.0 0.0 0:00 kmcheck 5 root 15 0 0 0 0 SW 0.0 0.0 0:00 keventd 9 root 15 0 0 0 0 SW 0.0 0.0 0:24 bdflush
To exit top, press Enter q.
To see processes by CPU utilization, type p. To view information about a single user like the Domino server, type u and you will be prompted for the user ID; or you can press Enter for all users. Example 9-5 shows an example of the processes running under our Domino server ID domserva.
Example 9-5: TOP display
PID USER PRI NI SIZE RSS SHARE STAT %CPU %MEM TIME COMMAND 632 domserva 20 0 332 264 164 S 0.0 0.0 0:00 su 633 domserva 15 0 444 208 36 S 0.0 0.0 0:00 bash 7410 domserva 21 0 1476 1384 1268 S 0.0 0.2 0:00 bash 7483 domserva 15 0 17888 17M 6688 S 0.0 3.4 0:03 java 7495 domserva 15 0 17888 17M 6688 S 0.0 3.4 0:00 java 7496 domserva 15 0 17888 17M 6688 S 0.0 3.4 0:00 java 7497 domserva 15 0 17888 17M 6688 S 0.0 3.4 0:00 java 7498 domserva 15 0 17888 17M 6688 S 0.0 3.4 0:00 java 7499 domserva 15 0 17888 17M 6688 S 0.0 3.4 0:00 java 7500 domserva 15 0 17888 17M 6688 S 0.0 3.4 0:00 java 7503 domserva 25 0 17888 17M 6688 S 0.0 3.4 0:03 java 7504 domserva 15 0 17888 17M 6688 S 0.0 3.4 0:00 java 7505 domserva 15 0 17888 17M 6688 S 0.0 3.4 0:00 java 7506 domserva 15 0 17888 17M 6688 S 0.0 3.4 0:00 java 7507 domserva 15 0 17888 17M 6688 S 0.0 3.4 0:00 java 7508 domserva 15 0 17888 17M 6688 S 0.0 3.4 0:00 java 7509 domserva 15 0 17888 17M 6688 S 0.0 3.4 0:00 java
On a lightly-loaded system such as our test server, top often appeared at the top of the list when sorted by CPU utilization. You can set the frequency with which top updates the screen by issuing s. Even then, since top has a fairly large footprint in terms of memory and CPU, we recommend you do not allow it to run continuously. Instead, use it when you think the system is running slowly, to determine which processes are using the most CPU.
To learn more about top options, press h while top is running.
If you prefer a graphical view, there are alternatives to top in the KDE or GNOME desktops. In KDE, select Process Management from the Utilities menu. The GNOME desktop tool is System Monitor.
vmstat
The vmstat command reports virtual memory statistics. It is one of the simplest, but most useful tools, because it reports important data about CPU, memory utilization, and disk I/O. The format of the vmstat command is:
vmstat interval_seconds number_of_intervals
The vmstat command without options displays the averages since system reboot. For example:
domserva@linuxa:~> vmstat procs memory swap io system cpu r b w swpd free buff cache si so bi bo in cs us sy id 0 0 0 1760 4824 34320 324736 0 0 90 91 0 1241 4 4 92
vmstat with options is shown in Example 9-6. We get a sampling of memory use every 10 seconds.
Example 9-6: vmstat output
domserva@linuxa:~> vmstat 10 5 procs memory swap io system cpu r b w swpd free buff cache si so bi bo in cs us sy id 0 0 0 88464 3036 3404 190720 24 8 229 148 0 246 38 11 51 0 0 0 88464 3024 3412 190720 0 0 0 12 0 1745 0 0 100 0 0 0 88464 3012 3420 190720 0 0 0 2 0 1712 0 0 99 1 0 0 88440 3048 3436 190744 2 0 2 8 0 1685 1 1 98 0 0 0 88432 3032 3444 190744 0 0 0 2 0 1738 0 0 100
sar
The sar (system activity reporter) command collects and reports information about system activity, including CPU, paging, file I/O, network, and so on. This command displays records previously saved in a file specified by a flag. By default, it displays the standard system activity daily data file, /var/log/sa/sadd file, where the dd parameter indicates the current day.
You can select information about specific system activities using flags. Not specifying any flags selects only CPU activity. You can save the output of the sar command into a file for later processing by another application. Records are time-stamped. Depending on the flags used, the output file can be saved in a format that can be easily read by a relational database system or by a pattern processing command like awk. Example 9-7 shows output from the sar command.
Example 9-7: sar output
domserva@linuxa:~> sar sar Linux 2.4.19-4suse-SMP (linuxa) 08/21/2003 05:50:00 AM CPU %user %nice %system %idle 06:00:01 AM all 49.70 0.00 9.74 40.56 06:10:00 AM all 50.17 0.00 9.43 40.40 06:20:00 AM all 49.74 0.00 9.79 40.48 06:30:00 AM all 49.72 0.00 9.84 40.44 06:40:00 AM all 49.70 0.00 9.75 40.55 06:50:00 AM all 49.06 0.00 10.87 40.06 07:00:01 AM all 49.46 0.00 10.03 40.51 07:10:00 AM all 48.45 0.00 11.20 40.35 07:20:00 AM all 49.83 0.00 9.87 40.30 07:30:00 AM all 48.49 0.00 11.29 40.22 07:40:00 AM all 49.12 0.00 9.70 41.19
ps and pstree
The ps command displays a list of the currently running processes. Here are several examples.
| ps -ef | Displays a list of all currently running processes with full details, including user, process ID, start time, time, and program. |
Using ps -ef, you can check which processes are running in the Domino server, as shown in Figure 9-2 on page 226.
domserva@linuxa:~> ps -ef |grep domserva domserva 2419 2225 0 Aug21 pts/0 00:00:00 su domserva domserva 2420 2419 0 Aug21 pts/0 00:00:00 bash domserva 18513 2420 0 07:51 pts/0 00:00:00 bash domserva 18586 18513 0 07:51 pts/0 00:00:02 /opt/lotus/notes/latest/zlinux/jvm/bin/exe/java -Xoss5M -Djava.compiler=NONE -DDISPLAY=-cp /opt/lotus/notes/latest/zlinux/dconsole.jar lotus.domino.console.DominoController -jc -c domserva 18626 18613 0 07:51 pts/0 00:00:00 /opt/lotus/notes/latest/zlinux/logasio NOTESLOGGER reserved domserva 18635 18618 0 07:51 pts/0 00:00:00 /opt/lotus/notes/latest/zlinux/server -j domserva 18636 18618 0 07:51 pts/0 00:00:01 /opt/lotus/notes/latest/zlinux/server -j domserva 18675 18613 0 07:51 pts/0 00:00:00 /opt/lotus/notes/latest/zlinux/event domserva 18697 18675 0 07:51 pts/0 00:00:00 /opt/lotus/notes/latest/zlinux/event domserva 18705 18697 0 07:51 pts/0 00:00:00 /opt/lotus/notes/latest/zlinux/event domserva 18706 18618 0 07:51 pts/0 00:00:00 /opt/lotus/notes/latest/zlinux/server -j domserva 18707 18618 0 07:51 pts/0 00:00:00 /opt/lotus/notes/latest/zlinux/server -j domserva 18708 18618 0 07:51 pts/0 00:00:00 /opt/lotus/notes/latest/zlinux/server -j domserva 18709 18618 0 07:51 pts/0 00:00:00 /opt/lotus/notes/latest/zlinux/server -j domserva 18710 18618 0 07:51 pts/0 00:00:00 /opt/lotus/notes/latest/zlinux/server -j domserva 18711 18618 0 07:51 pts/0 00:00:00 /opt/lotus/notes/latest/zlinux/server -j domserva 18857 18710 0 07:51 pts/0 00:00:00 /opt/lotus/notes/latest/zlinux/update domserva 18859 18710 0 07:51 pts/0 00:00:05 /opt/lotus/notes/latest/zlinux/replica domserva 18864 18710 0 07:51 pts/0 00:00:00 /opt/lotus/notes/latest/zlinux/router domserva 18866 18710 0 07:51 pts/0 00:00:00 /opt/lotus/notes/latest/zlinux/amgr domserva 18881 18710 0 07:51 pts/0 00:00:03 /opt/lotus/notes/latest/zlinux/adminp domserva 18883 18710 0 07:51 pts/0 00:00:00 /opt/lotus/notes/latest/zlinux/calconn domserva 18886 18710 0 07:51 pts/0 00:00:01 /opt/lotus/notes/latest/zlinux/sched domserva 19045 18866 0 07:51 pts/0 00:00:00 /opt/lotus/notes/latest/zlinux/amgr -e 1 domserva 19161 19055 0 07:51 pts/0 00:00:00 /opt/lotus/notes/latest/zlinux/cldbdir domserva 19878 19018 0 08:21 pts/0 00:00:00 /opt/lotus/notes/latest/zlinux/replica
Figure 9-2: Output of the ps -ef command
| ps -U userid | Displays the currently running processes associated with that user. For example, ps -f -U domserva displays a detailed list of all processes related to our Domino server domserva. |
| ps -efww | The ww option displays the command line options of each process. |
| ps --help | Displays help for the ps command. |
For more information on the ps command, enter man page on your Linux system.
The pstree command displays these same processes, but in a tree format starting with the first process called init. Here are several examples.
| pstree | Displays all processes starting at init. |
| pstree -l | Wraps the lines instead of truncating them. This is handy if your display window is truncating the right side of the tree. |
| pstree userid | Displays the portion of the tree related to that user. To see the processes for our Domino server in Figure 9-3, we entered pstree domserva. |
domserva@linuxa:~> pstree domserva bash bash---bash---java---java-+-24*[java ] `-java---server-+-event---event---8*[event] |-logasio---logasio---2*[logasio] `-server-+-70*[server] |-server-+-adminp---adminp--+ | |-amgr-+-amgr---3*[+ | | `-amgr---amg+ | |-calconn---calconn+ | |-replica---replica+ | |-router---router--+ | |-sched---sched---3+ | `-update---update--+ |-server-+-Y4628185.sh | `-Y8609381.sh---ios+ `-server-+-cldbdir---cldbdir+ `-clrepl---clrepl--+ bash---pstree
Figure 9-3: Output of the pstree command
ipcs
The ipcs command provides information on shared memory and semaphores; following are the options:
| -m | shared memory segments |
| -q | message queues |
| -s | semaphore arrays |
| -a | all (this is the default) |
You can use the ipcs command to check whether there are still any shared memory segments after an abnormal Domino server shutdown. All the shared memory segments for Domino begin with 0xf8. To display them, you can issue the command ipcs -m|grep 0xf8 as shown in Figure 9-4.
ipcs -m|grep 0xf8 domserva@linuxa:~>ipcs -m|grep 0xf8 0xf8232000 1703936 domserva 660 5024752 13 0xf8232001 1736705 domserva 660 8388608 13 0xf8232002 1769474 domserva 660 262144 13 0xf8232003 1802243 domserva 660 262144 13 0xf8232004 1835012 domserva 660 262144 13 0xf8232005 1867781 domserva 660 262144 13 0xf8232006 1900550 domserva 660 262144 13 0xf8232007 1933319 domserva 660 262144 13 0xf8232008 1966088 domserva 660 262144 13 0xf8232009 1998857 domserva 660 262144 13 0xf823200a 2031626 domserva 660 8388608 13
Figure 9-4: ipcs -m
You can then use the ipcrm command to remove the shared memory IDs.
9.3.2 Performance monitoring with RMF PM for Linux
Resource Measurement Facility Performance Monitoring (RMF PM) with support for Linux Enterprise Server (RMF PMS) is a tool that can be used to monitor the various resources in a Linux on zSeries system. It is used, in conjunction with the RMF PM client application, to gather and analyze data.
Using RMF PM, you can:
-
Gather historical performance data.
-
Store the data in spreadsheet format.
-
Use a graphical user client to access performance data.
-
Generate graphical trend reports.
RMF PMS for Linux is a part of a larger family of RMF products. There is an RMF PM tool for z/OS; the same workstation client tool can be used to analyze z/OS and Linux systems.
At the time of writing, the RMF PM application for Linux was a Technology Edition. Both the server data gatherer portion of RMF PMS and the RMF PM client can be downloaded from the IBM RMF Web site. In addition to the code, there is a brief tutorial available at:
-
http://www.ibm.com/servers/eserver/zseries/zos/rmf/rmfhtmls/pmweb/pmlin.htm
Figure 9-5 presents a schematic overview of RMF PMS.
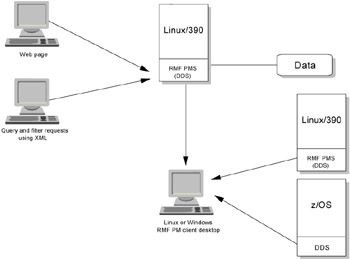
Figure 9-5: RMF PMS overview
Gathering data on the Linux server
RMF PMS is the modular data gatherer portion of the tool, and it runs on the Linux server. The data gatherer modules work as daemons. There are daemons to gather data for CPU, network, filesystem, DASD I/O, memory, and the Apache HTTP server.
The daemons do not need to be synchronized; they can all be started or just selected ones can be started. The default interval collection time is 60 seconds.
When the data gatherer daemons have been started, data is collected in a directory on the Linux server. If the data gatherers are allowed to run continuously, RMF PMS will create a new directory at midnight to hold the data for that day. You can extract this data to an application like the RMF PM workstation, or to another application that you develop. RMF PMS provides an archive function to reduce the amount of active data on your Linux server.
The following lists present a few examples of the available metrics. For more information, see the online documents in the rmfpms directory.
CPU resource metrics
-
Load average
-
Percent of CPU total active by processor
-
Percent of CPU idle time
-
Percent of CPU time in kernel mode by process
-
Accumulated CPU time in user mode by process
Network resource metrics
-
Bytes received/transmitted
-
Packets received/transmitted by network device
-
Receive/transmit errors
Filesystem resource metrics
-
Space available
-
Size of all filesystems
-
DASD I/O requests per second
-
Percent of space used
-
DASD I/O average response time per request
Memory resource metrics
-
Memory used
-
Swap space used
-
Cache memory
-
Number of pages swapped in/out
-
Shared memory
-
Total memory size
Analyzing the data using the RMF PM client
The option we used for analyzing the data was the RMF PM client. The client is available for Linux and the Windows desktop. We used the Windows desktop.
The RMF PM client connects to the Linux server and extracts the data which has been gathered. The client can extract the data in real time, sampling at 60-second intervals, or can extract historical data which has been gathered over a longer period of time (a day, for example).
The initial client desktop is shown in Figure 9-6 on page 230.
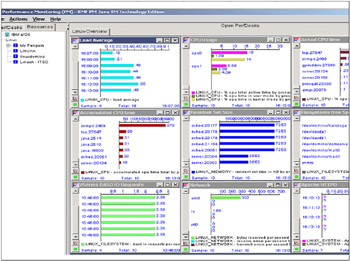
Figure 9-6: RMF PM client desktop
Both the data gathering on the server and the sampling from the PM client can consume large amounts of CPU if you use the default server and client setup. We recommend that you decide what data you need to gather and disable the other data gatherer daemons.
For example, if you are interested primarily in CPU utilization, you may not need to gather data on the filesystem or I/O requests, so you can disable the file and DASD daemons. If you are not running the Apache HTTP server, you don't need to start the daemon. By the same token, if you do not need to analyze all the data at the workstation, you can delete some of the
DataViews from your performance desktop. Data at the client is presented in DataViews. Each of the small windows shown in Figure 9-6 is a DataView. Initially the client captures data for nine DataViews. We did not have the Apache HTTP server, so that DataView is empty.
You can customize which DataViews you have on your performance desktop, and you can selectively capture and analyze data for each one. The DataView windows can be resized and maximized to provide more information. So, you are not limited to seeing the small number of processes shown in the Actual CPU time DataView in the figure. If you maximize the window, you will see all the running processes.
The DataViews that you see on the desktop provide a snapshot of the Linux server at one sampling. You can scroll forward and backward through the samples. You can also take a series of these samples and graph them. Figure 9-7 on page 231 shows a graph of 13 samples of CPU utilization for the Domino Server task taken August 27 from 16:04 to 16:16.
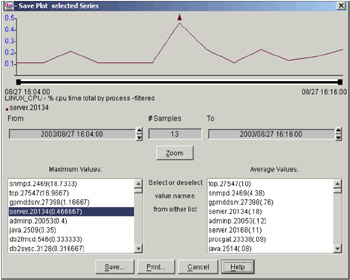
Figure 9-7: RFM PM graph
|
| < Day Day Up > |
|
EAN: 2147483647
Pages: 162