Foundation and Supplemental Topics
Verifying System ConfigurationBesides configuring your Cisco IPS to protect your network, you also need to periodically check the operation of your IPS sensors. This may be as simple as verifying the software version running on your sensor or manually capturing network packets on a specific sensor interface. This chapter focuses on the following:
Viewing Sensor ConfigurationUsing the sensor's CLI, you can view various sensor configuration parameters as well as the software version currently installed on the sensor. You will periodically perform the following tasks:
Note The Product Evolution Program (PEP) provides a consistent mechanism to identify hardware characteristics for Cisco products (including a unique identifier for each device). This information provides customers with the ability to more effectively integrate and manage evolving Cisco hardware products in their network and business operations. Displaying Software VersionMaintaining the latest Cisco IPS software version is important to maintaining an effective security posture. Knowing which software version is running on your sensors enables you to identify which sensors need to be upgraded and which sensors have already been upgraded when new software, such as signature releases, becomes available. To display the version of software running on a sensor, you use the show version sensor CLI command. This command displays various characteristics about the sensor, such as the following:
The output in Example 12-1 shows the information provided by the show version command. Example 12-1. Displaying the Sensor's System InformationIds4240# show version Application Partition: Cisco Intrusion Prevention System, Version 5.0(0.21)S129.0 OS Version 2.4.26-IDS-smp-bigphys Platform: IPS-4240-K9 Serial Number: JAB0815R01X No license present Sensor up-time is 19 days. Using 354369536 out of 1984704512 bytes of available memory (17% usage) system is using 17.3M out of 29.0M bytes of available disk space (59% usage) application-data is using 39.0M out of 166.8M bytes of available disk space (25% usage) boot is using 35.5M out of 68.6M bytes of available disk space (55% usage) MainApp 2004_Dec_13_03.00 (Release) 2004-12-13T03:19:10-0600 Running AnalysisEngine 2004_Dec_13_03.00 (Release) 2004-12-13T03:19:10-0600 Running CLI 2004_Dec_13_03.00 (Release) 2004-12-13T03:19:10-0600 Upgrade History: IDS-K9-maj-5.0-0.21-S91-0.21-.pkg 09:00:00 UTC Fri Dec 10 2004 Recovery Partition Version 1.1 - 5.0(0.21)S91(0.21) Ids4240# Displaying Sensor ConfigurationAfter configuring your sensor, you will want to save the sensor's configuration in case you need to re-image the sensor. The show configuration sensor CLI command displays the currentconfiguration of the sensor. The configuration is divided into the following service categories that correspond to the global configuration service CLI command:
The partial output in Example 12-2 shows the initial information from the show configuration CLI command. Example 12-2. Viewing the Sensor's ConfigurationIds4240# show configuration ! ------------------------------ ! Version 5.0(0.21) ! Current configuration last modified Tue Dec 14 13:49:43 2004 ! ------------------------------ service analysis-engine exit ! ------------------------------ service authentication exit ! ------------------------------ service event-action-rules rules0 variables server-farm address 10.30.10.10-10.30.10.40 variables Test address 10.20.10.10,10.30.10.0,10.40.10.0-10.40.10.20 overrides deny-attacker-inline override-item-status Enabled risk-rating-range 90-100 exit filters edit NewFilter signature-id-range 61500 attacker-address-range 10.200.10.0-10.200.10.255 risk-rating-range 50-100 actions-to-remove request-snmp-trap exit filters edit PhoneConfigTFTP signature-id-range 6412 attacker-address-range 10.10.20.0-10.10.20.255 actions-to-remove deny-packet-inline filter-item-status Disabled exit filters edit TestFilter actions-to-remove reset-tcp-connection exit filters move TestFilter begin filters move PhoneConfigTFTP after TestFilter filters move NewFilter after PhoneConfigTFTP exit ! ------------------------------ service host network-settings host-ip 10.40.10.100/24,10.40.10.1 host-name Ids4240 telnet-option disabled access-list 10.10.10.0/24 access-list 10.0.0.0/8 access-list 64.101.0.0/16 exit time-zone-settings offset -360 standard-time-zone-name GMT-06:00 exit exit ! ------------------------------ Displaying Sensor PEP InventorySometimes you may need to display the PEP inventory information for your sensor. The PEP information includes information such as the following:
The PEP information is provided by the show inventory sensor CLI command. Sample output from the show inventory command is displayed in Example 12-3. Example 12-3. Displaying the Sensor's Inventory InformationIds4240# show inventory Name: "Chassis", DESCR: "IPS 4240 Intrusion Prevention Sensor" PID: IPS-4240-K9, VID: V01, SN: JAB0815R01X Name: "Power Supply", DESCR: "" PID: ASA-180W-PWR-AC, VID: V01 , SN: DTH0822000F Ids4240# Viewing Sensor StatisticsTo check the operation of your sensors, you can view operational statistics from the sensor. The operational statistics fall into the following categories (keywords for the show statistics CLI command):
You can view this information by using the show statistics CLI command. You must also supply the statistics category that you want to view. For instance, suppose that you want to view the host statistics on the sensor. To view this information, you use the CLI command in Example 12-4. Example 12-4. Viewing the Sensor's Host Statistics InformationIds4240# show statistics host General Statistics Last Change To Host Config (UTC) = 23:01:54 Sun Jan 02 2005 Command Control Port Device = Management0/0 Network Statistics ma0_0 Link encap:Ethernet HWaddr 00:0F:F7:75:4A:94 inet addr:10.40.10.100 Bcast:10.40.10.255 Mask:255.255.255.0 UP BROADCAST RUNNING MULTICAST MTU:1500 Metric:1 RX packets:47451 errors:0 dropped:0 overruns:0 frame:0 TX packets:75437 errors:0 dropped:0 overruns:0 carrier:0 collisions:0 txqueuelen:1000 RX bytes:3371163 (3.2 MiB) TX bytes:84409951 (80.4 MiB) Interrupt:16 Base address:0x9c00 Memory:f8300000-f8300038 NTP Statistics status = Not applicable Memory Usage usedBytes = 354967552 freeBytes = 1629736960 totalBytes = 1984704512 Swap Usage Used Bytes = 0 Free Bytes = 0 Total Bytes = 0 CPU Statistics Usage over last 5 seconds = 0 Usage over last minute = 1 Usage over last 5 minutes = 0 Memory Statistics Memory usage (bytes) = 354873344 Memory free (bytes) = 1629831168 Auto Update Statistics lastDirectoryReadAttempt = N/A lastDownloadAttempt = N/A lastInstallAttempt = N/A nextAttempt = N/A Ids4240# Instead of viewing the statistics for each of the categories individually via the CLI, you can also use IDM to view all of the statistics categories. Viewing the statistics information via IDM involves the following steps:
Figure 12-1. IDM Statistics Screen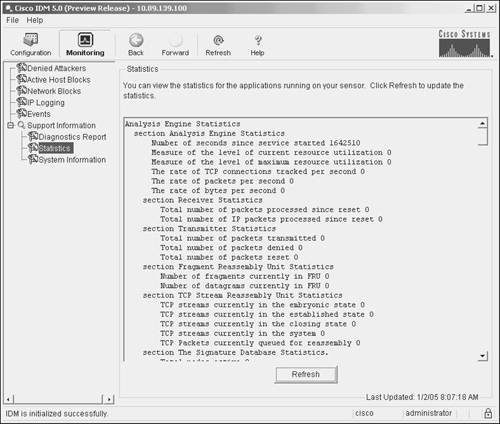 Note To update the statistics information displayed on the IDM Statistics screen, you can click on Refresh. Viewing Sensor EventsTo monitor the attacks against your network, you monitor events from your sensors by using a monitoring application such as Security Monitor (http://www.cisco.com/go/ids). Sometimes, however, you may want to check the sensor events to verify that the sensor is operating correctly. In these situations, you can use both the sensor CLI and the IDM to view events on the sensor. Viewing Events Using the CLIThrough the CLI, you can view events generated on the sensor by using the show events command. This command enables you to selectively display events based on the keywords shown in Table 12-2.
For instance, if you want to display all of the blocking events, you use the following command: Sensor# show events nacWhen you issue the show events command, the sensor software continues to display events until you press Ctrl-C. By default, the show events command displays events chronologically, beginning from when you issue the command. You can also display events that are currently stored in the Event Store by adding the past keyword to the show events command. This keyword causes the command to display events beginning a specified number of hours and minutes in the past. For instance, suppose you want to show all of the error events that have occurred within the last four and a half hours. The command in Example 12-5 displays this information. Example 12-5. Viewing Sensor Events Using the CLIIds4240# show events error past 4:30 evError: eventId=1103038377039120319 severity=warning vendor=Cisco originator: hostId: Ids4240 appName: cidwebserver appInstanceId: 1046 time: 2005/01/02 23:14:51 2005/01/02 17:14:51 GMT-06:00 errorMessage: name=errTransport while sending a TLS warning alert close_notify, the following error occurred: socket error [3,32] Ids4240# Note When specifying a time value, you can also specify a number of seconds, but the number of seconds is optional. Sometimes you may want to limit the events generated by the show events command. Appending the | character (known as a pipe in UNIX terminology) to the command (and other CLI commands) enables you to limit the output by using one of the keywords shown in Table 12-3.
Suppose that you want to display all of the events from the cidwebserver application that have occurred in the past two hours. The command to retrieve those events is displayed in Example 12-6. Example 12-6. Filtering Sensor Events Displayed Using the CLI Ids4240# show events past 02:00 | include cidwebserver evStatus: eventId=1103038377039120318 vendor=Cisco originator: hostId: Ids4240 appName: cidwebserver appInstanceId: 261 time: 2005/01/02 23:14:26 2005/01/02 17:14:26 GMT-06:00 loginAction: action=loggedIn description: User logged into HTTP server userName: cisco userAddress: port=4083 10.66.254.58 evError: eventId=1103038377039120319 severity=warning vendor=Cisco originator: hostId: Ids4240 appName: cidwebserver appInstanceId: 1046 time: 2005/01/02 23:14:51 2005/01/02 17:14:51 GMT-06:00 errorMessage: name=errTransport while sending a TLS warning alert close_notify, the following error occurred: socket error [3,32] Viewing Events Using IDMIDM also enables you to display various events by using the events monitoring screen (see Figure 12-2). Figure 12-2. IDM Events Monitoring Screen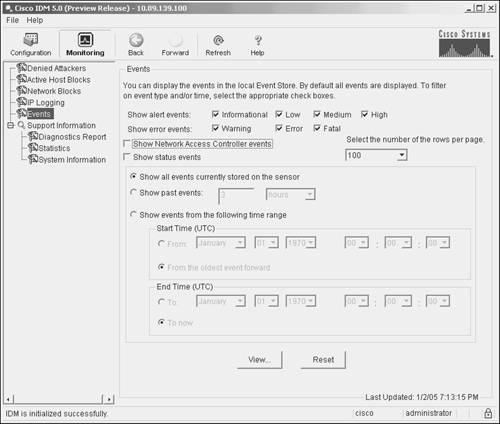 When displaying events by using IDM, you need to select the event types to display along with the time frame in which the events occurred. Selecting Event TypesWhen displaying events by using IDM, you specify the types of events to display by selecting check boxes next to specific event types. For alert events you can select the following event types (enabled by default):
For error events you can select the following event types (enabled by default):
You can also choose whether or not to display status events and Network Access Controller (NAC) events by selecting the appropriate check boxes (both disabled by default). Selecting Time Frame for EventsWhen choosing the time frame for events, you can choose one of the following options:
Using the IDM Event ViewerWhen you view events using IDM, they are displayed in the IDM Event Viewer (Figure 12-3). If the number of events selected by your criteria exceeds a single page, you can move through the events by clicking on the Back or Next buttons. You can also display the details for an event by first highlighting the event (clicking on it) and then clicking on Details. This will display the details for the highlighted event in a separate window (Figure 12-4). Figure 12-3. IDM Event Viewer Screen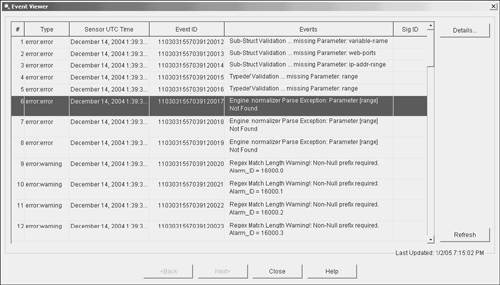 Figure 12-4. IDM Event Details Screen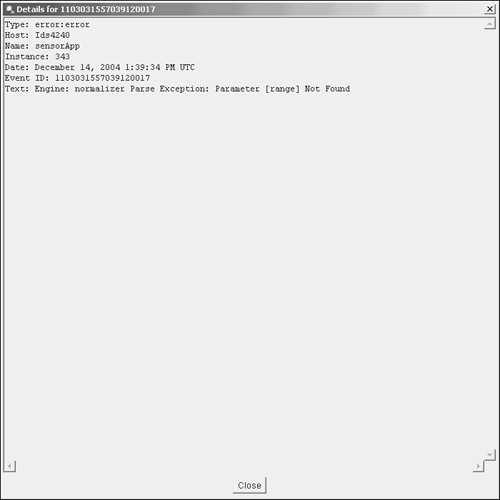 Debugging Sensor OperationBesides viewing the sensor configuration and the statistics on various sensor parameters, it is important to be able to verify that the sensor is capturing network traffic. Generating debugging information using the show tech-support CLI also provides valuable information about the operation of your sensor. Tasks involved in debugging sensor operation fall into the following categories:
Verifying Interface OperationUsing the show interfaces CLI command, you can check the status of the interfaces on your IPS sensor. When you use this command without any parameters, it will display the operational information for all of the sensor's interfaces. You can also limit the output by specifying an interface (such as GigabitEthernet0/0). Table 12-4 shows the keywords that you can specify with the show interfaces command.
Note Not all interface types are available on every sensor. Using the show interfaces ? CLI command will display the available interfaces for your specific sensor. The output in Example 12-7 shows the interface statistics for the management interface. Example 12-7. Displaying the Statistics for the Management InterfaceIds4240# show interfaces Management0/0 MAC statistics from interface Management0/0 Media Type = TX Link Status = Up Link Speed = Auto_100 Link Duplex = Auto_Full Total Packets Received = 54299 Total Bytes Received = 3865128 Total Multicast Packets Received = 0 Total Receive Errors = 0 Total Receive FIFO Overruns = 0 Total Packets Transmitted = 85959 Total Bytes Transmitted = 95837551 Total Transmit Errors = 0 Total Transmit FIFO Overruns = 0 Ids4240# To clear the operational statistics for the sensor interface, you add the clear keyword to the show interfaces command, as shown in the following command: show interfaces clearThis command displays the interface statistics and then clears all of the parameters. Clearing the statistics is useful when you want to start from known values and then observe how the parameters are changing. Appending the | character to the command enables you to limit the output when you use one of the following keywords:
Using begin causes the output to start at the first instance of the text you specify after the begin keyword. For instance specifying | begin interface will cause the output to start at the first instance of the word interface in the output. The include keyword causes the output to only show lines that include the specified text, while the exclude keyword causes the output to show only the lines that do not include the specified text. Capturing PacketsBesides viewing the statistics for the interfaces on the sensor, sometimes you may want to view the actual packets being received on an interface. The packet capture CLI command enables you to capture packets for a specific interface. The packets are saved to a file in tcpdump format. Packets are captured until you press Ctrl-C. The following command captures traffic from GigabitEthernet0/0: packet capture GigabitEthernet0/0Note You can limit the traffic captured by the packet capture command by specifying the expression keyword followed by a tcpdump filter expression. For more information on tcpdump filter expressions, refer to the documentation for tcpdump. The packets from the packet capture command are stored in a file named packet-file. You can view the packets by using the packet display command, as shown in Example 12-8. Example 12-8. Displaying Captured Packets Stored in packet-fileIds4240# packet display packet-file reading from file /usr/cids/idsRoot/var/packet-file, link-type EN10MB (Ethernet) 09:45:11.922176 00:01:c9:6d:64:fa > 01:00:0c:cc:cc:cc snap ui/C len=35 09:45:11.922180 00:01:c9:6d:64:fa > 01:00:0c:00:00:00 snap ui/C len=65 09:45:12.922078 00:01:c9:6d:64:fa > 01:00:0c:cc:cc:cc snap ui/C len=35 09:45:12.922080 00:01:c9:6d:64:fa > 01:00:0c:00:00:00 snap ui/C len=65 09:45:13.975583 CDPv2, ttl: 180s, Device-ID 'stat-6000', length 424 09:45:13.977456 CDPv2, ttl: 180s, Device-ID 'stat-6000', length 424 09:45:13.979205 CDPv2, ttl: 180s, Device-ID 'stat-6000', length 424 09:45:15.562836 802.1d config 8410.00:d0:00:2e:dc:00.806b root 8410.00:d0:00:2e:dc:00 pathcost 0 age 0 max 20 hello 2 fdelay 15 09:45:17.563393 802.1d config 8410.00:d0:00:2e:dc:00.806b root 8410.00:d0:00:2e:dc:00 pathcost 0 age 0 max 20 hello 2 fdelay 15 Ids4240# You can also display packets without saving them to a file by using the packet display command and specifying the interface on which you want to see the traffic. The output in Example 12-9 shows traffic captured from GigabitEthernet 0/0 using the packet display command. Example 12-9. Displaying Captured Packets for GigabitEthernet0/0Ids4240# packet display GigabitEthernet0/0 Warning: This command will cause significant performance degradation tcpdump: WARNING: ge0_0: no IPv4 address assigned tcpdump: verbose output suppressed, use -v or -vv for full protocol decode listening on ge0_0, link-type EN10MB (Ethernet), capture size 65535 bytes 09:46:34.796832 00:01:c9:6d:64:fa > 01:00:0c:cc:cc:cc snap ui/C len=35 09:46:34.796835 00:01:c9:6d:64:fa > 01:00:0c:00:00:00 snap ui/C len=65 09:46:35.796987 00:01:c9:6d:64:fa > 01:00:0c:cc:cc:cc snap ui/C len=35 09:46:35.796990 00:01:c9:6d:64:fa > 01:00:0c:00:00:00 snap ui/C len=65 09:46:36.850740 CDPv2, ttl: 180s, Device-ID 'stat-6000', length 424 09:46:36.852612 CDPv2, ttl: 180s, Device-ID 'stat-6000', length 424 09:46:36.854361 CDPv2, ttl: 180s, Device-ID 'stat-6000', length 424 09:46:37.590140 802.1d config 8410.00:d0:00:2e:dc:00.806b root 8410.00:d0:00:2e:dc:00 pathcost 0 age 0 max 20 hello 2 fdelay 15 8 packets captured 8 packets received by filter 0 packets dropped by kernel Ids4240# Note You can also transfer files from your sensor to other systems to view the captured information by using freely available tools, such as Ethereal (http://www.ethereal.com). To copy the packet-capture file from the sensor, use the copy command, as in the following example that uses Secure Copy (SCP): copy packet-file scp:Generating Tech-Support OutputUsing the show tech-support command, you can display a comprehensive list of status and system information about your sensor. This command consolidates the output from the following commands and other data sources:
The Technical Assistance Center (TAC) frequently uses the output from this command to debug problems with the operation of your sensor. The syntax for the show tech-support command is as follows: show tech-support [page][password][destination destination-url] Table 12-5 explains the parameters for the show tech-support command.
When specifying a destination for the show tech-support command output, you can choose one of the following destination formats:
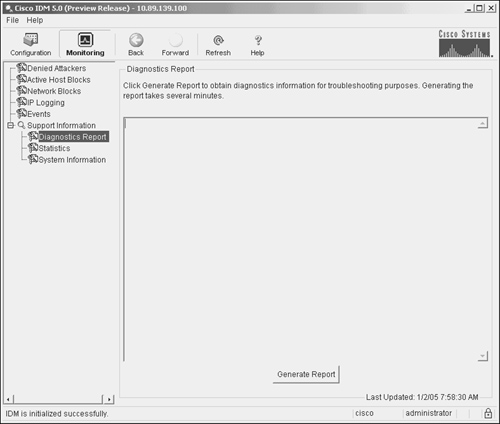
Note Using SCP protects the tech-support output from being viewed since the information is encrypted before it is transmitted across the network. Attackers will try to obtain this information to better understand how security protection is configured so that they can bypass it. Instead of specifying all of the options on the command line, you can specify just the server type. In this situation, you are prompted for the individual parameters, as in the sample output in Example 12-10. Example 12-10. Displaying tech-support Information Using Sensor CLIsensor# show tech-support destination scp: User: root Server's IP Address: 10.89.156.78 Port[22]: File name: Sensor4230.out Password: ******** Since this command has the capability to display passwords and other sensitive information, you can execute this command only using an account that has been assigned the Administrator role. You can also use IDM to generate the tech-support output. The steps to generate the tech-support output using IDM are as follows:
Figure 12-6. IDM Diagnostic Report Information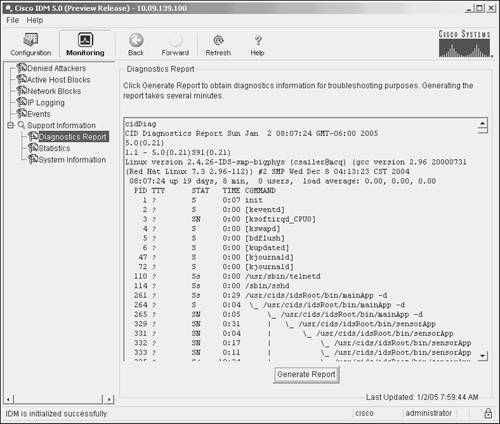 Note If you have already generated a diagnostic report during an IDM session, you will see the information from the previously generated report when you access the Diagnostic Report screen. You can view that information or refresh the information by clicking on Generate Report. Sensor SNMP AccessBesides using the sensor CLI and IDM to view the operation of your sensor, you can also access your sensor via Simple Network Management Protocol (SNMP). SNMP access to your sensor is configured using the service notification sensor CLI global configuration command. Using SNMP traps facilitates management in large deployments since the sensors can generate traps when a problem arises instead of having your management software continually poll all of your IPS devices. After issuing the service notification CLI command, you have the options listed in Table 12-6.
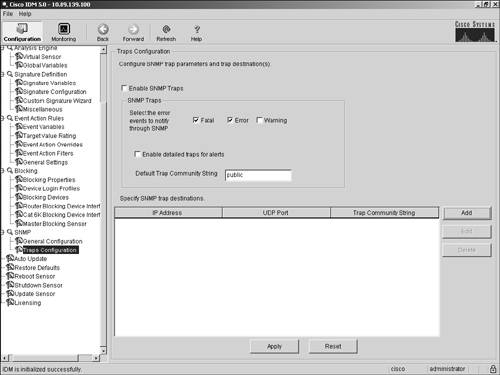
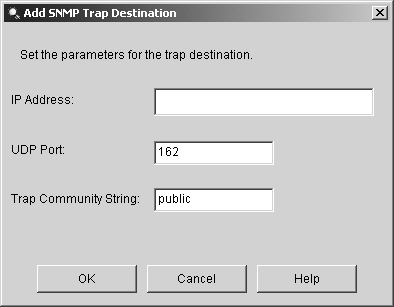
Enabling SNMP Traps by Using the Sensor CLINormally, your management console issues an SNMP request for information from your sensor. If the request is valid, the sensor replies with the requested information. This is referred to as polling (since the management device initiates the SNMP request to each of the sensors to check their status). Polling can become very cumbersome if you are managing a large number of sensors. When you enable SNMP traps (using the enable-notifications command), your sensor will automatically send SNMP messages to the IP addresses defined by the trap-destinations command. The trap destinations identify which systems are your SNMP management consoles. Whenever a relevant event happens on the sensor, the sensor automatically sends an unsolicited SNMP message to the specified management consoles. Since each sensor sends SNMP traps only when relevant events happen, the workload on your management consoles is reduced. Example 12-11 shows the commands needed to enable SNMP traps and define 10.20.10.10 as your SNMP management console. The example also defines the trap community name (for 10.20.10.10) as F$1%g. Example 12-11. Enabling SNMP Traps via the Sensor CLIIds4240# configure terminal Ids4240(config)# service notification Ids4240(config-not)# enable-notifications true Ids4240(config-not)# trap-destinations 10.20.10.10 Ids4240(config-not-tra)# trap-community-name F$1%g Ids4240(config-not-tra)# exit Ids4240(config-not)# exit Apply Changes:?[yes]: Ids4240(config)# Enabling SNMP Traps Using IDMInstead of using the sensor CLI, you can also enable traps using IDM. To enable traps and assign the SNMP community name of F$1%g to your management console located at 10.20.10.10, perform the following steps:
|
EAN: 2147483647
Pages: 119
- Article 310 Conductors for General Wiring
- Article 336 Power and Control Tray Cable Type TC
- Article 390 Underfloor Raceways
- Article 410: Luminaires (Lighting Fixtures), Lampholders, and Lamps
- Example No. D2(c) Optional Calculation for One-Family Dwelling with Heat Pump(Single-Phase, 240/120-Volt Service) (See 220.82)