Debugging
In an ideal world, all programmers would be so skilled and attentive to detail that they would write bug-free code. Unfortunately, we do not live in an ideal world. As such, debugging, or tracking down the source of errors and erroneous results, is an important task that all developers need to perform before they allow end-users to use their applications. This section will discuss some techniques for reducing the number of bugs in your code up front. We’ll also look at the tools and techniques in ASP.NET and the .NET platform used for debugging applications.
Understanding Bug Categories
There are three broad categories of bugs:
-
Syntax errors These errors occur when code breaks the rules of the language you’re using, such as a Visual Basic Sub statement without a closing End Sub, or a forgotten closing curly brace (}) in C#. These errors are the easiest to locate. The language compiler or IDE will alert you to them and will not allow you to compile your program until you correct them.
-
Semantic errors These errors occur in code that is correct according to the rules of the compiler, but that causes unexpected problems such as crashes or hanging on execution. A good example is code that executes in a loop but never exits the loop, either because the loop depends on a variable whose value was expected to be something different than it actually was or because the programmer forgot to increment the loop counter. Another category of errors in this area includes requesting a field from a dataset. Unless you are using a typed dataset, you have no way to tell if the field actually exists at compile time. These bugs are harder to detect and are one type of runtime error.
-
Logic errors Like semantic errors, logic errors are runtime errors. That is, they occur while the program is running. But unlike semantic errors, logic errors do not cause the application to crash or hang. Instead, logic errors result in unexpected values or output. This can be a result of something as simple as a mistyped variable name that happens to match another declared variable in the program (an argument for descriptive variable names rather than simple ones). This type of error can be extremely difficult to track down and eliminate, particularly since in complex programs it can be difficult (if not impossible) to reproduce a logic error reported by a user.
Preventing Bugs
Before we get into the discussion of how to debug the various errors you’re apt to run into in your applications, let’s take some time to look at strategies for preventing bugs in the first place. Preventing bugs is a much more efficient and much less expensive way to produce bug-free software.
The following list contains a few strategies that will help. This is not a comprehensive list by any means, but applying these strategies consistently will help you spend less time debugging your code and more time enjoying its rewards.
-
Write readable code Choose (or develop) and make consistent use of naming and coding standards. It’s not that important which standard you use, such as Hungarian notation (txtFirstName) or Pascal Casing (FirstName) or another naming convention, as long as you use one. You should also strive for consistency in your comments and encourage liberal commenting of code. Anything that makes code more readable and easier to understand will help eliminate bugs from the get-go.
-
Create effective test plans The only effective way to eliminate logic errors is to test every path of your application with every possible data value (or representative range of data) that a user could enter. This is difficult to manage without effective planning. You should create your test plans at the same time you’re designing the application, and you should update these plans as you modify the application design. To be effective, the test plans need to describe how to test each piece of functionality in the application. Test plans and other design documents can also help highlight design problems before they are implemented, preventing a wide array of bugs.
-
Use a rich IDE You don’t necessarily need to use Visual Studio .NET to develop your Web applications—ASP.NET does not require it—but you should consider developing in an IDE that provides syntax checking as you type. If you develop with Notepad, it is too easy to amass a number of syntax errors that go unnoticed until you try to run the page. Then you get to spend the next half hour or more eliminating the errors, one at a time, until you finally get the code to run. This is not an efficient way to write code.
-
Get another pair of eyes Whether you’re working on a team or building an application on your own, it is important to have someone else review your code (and test it, if possible). Developers are simply too close to their own code to catch every bug before (and sometimes even after) testing. A review by a different pair of eyes can help you catch what you’ve missed.
Compiling Web Forms Pages in Debug Mode
As mentioned in the introduction to this chapter, ASP.NET provides a great deal of information to developers when a bug or error halts execution of an application by throwing an exception. Some of this information, such as the stack trace, is available regardless of the mode that the code was compiled in. The following example shows what happens by default when a project created in Visual Studio .NET divides by zero in code to force an exception to be thrown.
Show the result of a divide-by-zero exception
-
In Visual Studio, open the Chapter_14 project created previously for this chapter. Add a new page by right-clicking on the root of the project in the Solution Explorer, selecting Add, then Add Web Form. Type the name of the form as DivByZero.aspx.
-
Add a label to the page.
-
Change to the code page by pressing F7. Add the line
Imports System.Diagnostics
to the top of the code-behind file, before the class definition.
-
Scroll down to the Page_Load event handler and add the following code:
Dim One As Integer = 1 Dim Zero As Integer = 0 Dim Result As Integer Debug.Assert(Zero <> 0, _ "Value of Zero will result in exception.") Result = One / Zero Label1.Text = "Got past the error."
-
Save DivByZero.aspx, its code-behind file, and the project, and then build the project.
-
Browse DivByZero.aspx using Internet Explorer. The resulting screen should look similar to the following illustration.
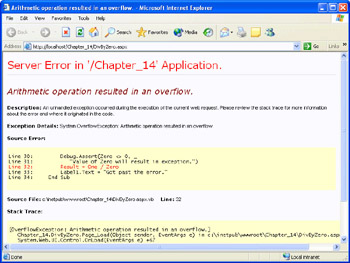
The previous illustration shows the information available when the application is compiled in Debug mode, the default when you create an application using Visual Studio .NET. Information such as the code with the error shown in context, as well as a stack trace, is available only in Debug mode. The following example shows the output when an error occurs and debugging is not enabled.
View divide-by-zero exception information without debugging enabled
-
Open the Chapter_14 project in Visual Studio and open Web.Config by double-clicking on it in the Solution Explorer.
-
Locate the <compilation> element in Web.Config and then change the debug attribute from True to False.
-
Select Configuration Manager from the Build menu. In the resulting dialog box, change the configuration for Chapter_14 from Debug to Release. Alternatively, you can change the Active Solution Configuration drop-down list to Release. You should rebuild the application whenever you change configuration settings.
-
Save Web.config and the project, and then build the project.
-
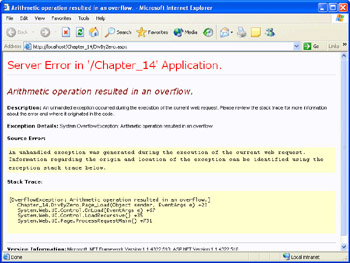
Browse DivByZero.aspx again using Internet Explorer. The resulting screen should look similar to the following illustration.
-
Reverse these steps to re-enable debugging for the Chapter_14 project.
The error message displayed this time is less informative, but this is potentially a good thing. For instance, none of the actual code is reproduced, and the stack trace is minimal. Thus, turning off debugging can reduce the risk of exposing sensitive information in your code by the occurrence of an exception. Of course, it’s best to avoid having sensitive information in your code in the first place, but making sure that debugging is disabled for public-facing systems can protect both your code and any sensitive information therein.
| Important | Because even the error page returned when debugging is disabled could provide useful information to a malicious user (such as the version information for the version of the .NET Framework you are running), you should, in addition to disabling debugging, provide custom error-handling pages wherever possible, as explained in Chapter 5. At a minimum, you should set the mode attribute of the <customErrors> element to On, so that no information other than the fact that an error has occurred is returned to the user’s browser. |
Understanding ASP.NET Error Messages
Anyone who’s seen the infamous ASP 015 error probably realizes just what a dramatic improvement the information in the previous examples represents. ASP.NET will provide descriptive information for both semantic and syntax errors, including the type of exception thrown (which allows you to provide effective and specific exception handling when you cannot completely prevent the exception) and the stack trace for the current request. As mentioned previously, you can also write to the trace output, and any trace statements that occur before execution is halted by an exception will be shown in the trace output.
Using the Visual Studio .NET Debugger
While the error information provided by ASP.NET at runtime can be useful in locating and eliminating syntax errors, most semantic and logic errors require a debugger. This tool uses the source code for a program and an executable compiled with debug symbols to let you step through your code line by line, set breakpoints, and examine the state or values of variables during program execution. You can also use the Assert method of the Debug class (part of theSystem.Diagnostics namespace) to test for certain conditions in your code and write messages to the output window of the debugger when the assertions fail.
The .NET Framework SDK comes with its own debugger, which provides rich debugging functionality for ASP.NET applications. The debugger is installed in the drivename\Program Files\Microsoft.NET\FrameworkSDK\GuiDebug folder (or in drivename\Program Files\Microsoft Visual Studio .NET 2003\SDK\v1.1\GuiDebug for Visual Studio installations) and is named DbgCLR.exe. You can execute the runtime debugger by double-clicking this file in Windows Explorer or by clicking Start then Run, and then entering the path and filename and clicking OK.
Generally, however, you will find that the integrated debugger included with Visual Studio .NET is superior to the SDK debugger. To view some of this debugger’s features, let’s take the DivByZero.aspx page as an example. To debug ASP.NET applications, you must be logged into the machine with an account that has administrator rights or use the Run As functionality to start Visual Studio .NET using an account with administrator rights.
Debug a divide-by-zero (arithmetic overflow) exception
-
Open the Chapter_14 project in Visual Studio and switch to the code-behind module for DivByZero.aspx.
-
If you have more than one project in your solution, right-click the Chapter_14 project in Solution Explorer and select Set As Startup Project. This sets Chapter_14 to be the project that is loaded when the project is run or debugged.
-
Right-click DivByZero.aspx in Solution Explorer and select Set As Start Page. This sets DivByZero.aspx to be the page that is loaded when the project is run or debugged.
-
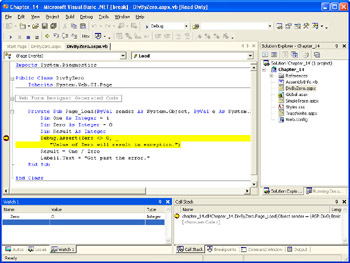
While it’s obvious what the problem is in this example, suppose you needed to determine exactly why the divide by zero exception was happening. One way to find out is to step through the code and check the values of your variables as each line executes. Start by scrolling down to the Page_Load event handler. Along the left side of the code window is a gray bar. Click on the gray bar to the left of the line with the Debug.Assert. A red dot indicating a breakpoint will appear on the gray bar, and the line will be highlighted. The following illustration shows the breakpoint set in Visual Studio .NET.
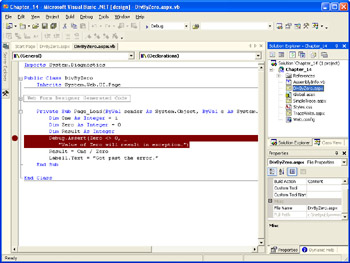
The presence of a breakpoint (or breakpoints) will cause the application to stop executing and display the debugging interface in the IDE when you run the application using the debug feature of VisualStudio. You can then examine the value of variables, step through the code line by line, and take other actions to determine why your code isn’t working as you expect.
-
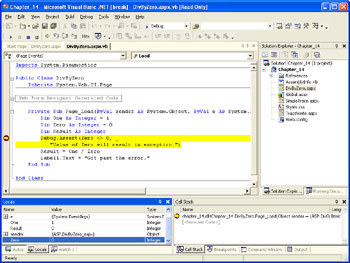
Run the application by selecting Start from the Debug menu (or by pressing F5). Since the breakpoint set in the previous step is in the Page_Load event handler, it will be reached immediately. The screen will look something like the following illustration.
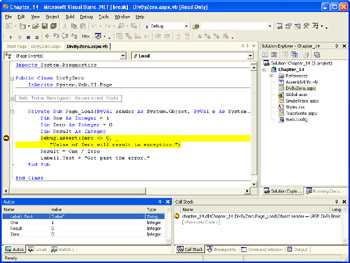
There are several ways to determine the values of variables while in the debugger. The first is to simply move your mouse over a variable and leave it there. A mouse hint appears telling you the name and value of the variable. Also, note that there is a Watch tab in the window at the bottom left of the screen just shown.
-
Click the Watch tab, and then click on the first line in the Watch window. You will be able to enter a variable name in the Name column. Type Zero, and then press Enter. The Watch window will look like the following illustration. (If you don’t see a Watch tab, you can summon the Watch window via the Debug menu. Select Debug, then Windows, and then Watch. Select the first Watch window in the menu.)
-
An easier way to see the value of a local variable is to look at the Locals window, by clicking in the Locals tab. This window shows all local variables, as shown in the illustration on the next page. (If you don’t see a Locals tab, you can summon the Locals window through the Debug menu as described in the previous step.)
-
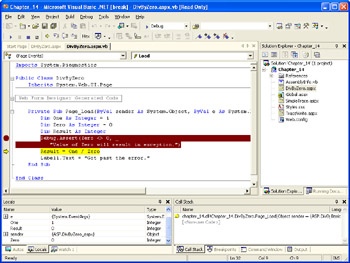
Press F10 to single-step through the code. In this case, you should move to the line with the actual division. The screen should look like the following illustration.
-
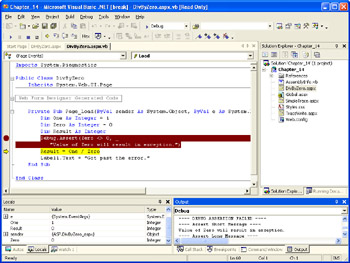
If the Output window is not visible, make it visible by selecting View, then Other Windows, and then Output. The output window will have the assert failure shown, as the following illustration shows. (You might need to scroll up in the Output window to see the message.)
-
Seeing that the variable Zero is indeed equal to 0, we could just stop debugging. We could also change the value of the variable Zero. Highlight the line with Zero on it in the Locals window, and then click in the Value column. We can now edit the value. Change the value by typing 1 and press Enter. The value changes to 1 and appears in red. (Red is the default, but in any event, the value appears in a color defined as indicating the value has changed.)
-
Press F10 again to single-step to the next statement. If a line calls a method that is compiled for debugging and you have access to the source, you can press F11 to step into the code. Press F5 to continue. The browser screen should appear, with the message “Got past the error.” displayed.
-
Close the browser.
-
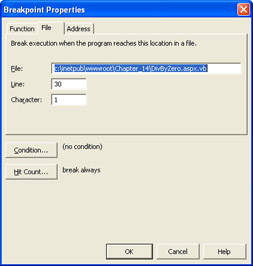
Right-click on the line with the breakpoint, and select Breakpoint Properties. The form shown in the illustration on the next page will appear.
-
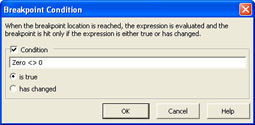
Click the Condition button. In the dialog box that appears, leave Condition checked, and enter Zero <> 0 in the text box. The dialog box should look something like the following illustration. When it does, click OK.
-
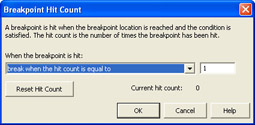
Click the Hit Count button. Change the value of the drop-down list labeled When the breakpoint is hit to break when the hit count is equal to. A text box should appear. Leave it set to 1. When the dialog box is set as shown in the illustration on the next page, click OK. Click OK again to close the Breakpoint Properties dialog box.
-
Run the application. It will run without breaking for the exception, and display a screen similar to the error screen you saw in the earlier DivByZero.aspx example.
-
Change the properties of the breakpoint as shown earlier, setting the condition to Zero = 0. Run the application. This time, the breakpoint will be reached with a condition that is true, and you will be brought to the debugger. Use F10 to single-step through the code, and you will see exactly how the exception is thrown. Seeing how the code runs by single-stepping through it can often be a huge help.
| Note | The technique used to start debugging in this example (selecting Debug, then Start or F5) causes all projects in the solution to be built prior to debugging. You can debug a single project and skip the build of other projects in the solution by right-clicking the project in Solution Explorer, highlighting Debug, and then selecting Start New Instance or Step Into New Instance. |
Using Debug.Assert
As shown in the previous examples, you can add Debug.Assert messages to your code to test certain conditions. The Assert method is overloaded and supports the following forms:
Debug.Assert(condition As Boolean) Debug.Assert(condition As Boolean, message As String) Debug.Assert(condition As Boolean, message As String, _ detailMessage as String)
-
condition is an expression that evaluates to true or false.
-
message is a string containing a brief message to display when condition returns false.
-
detailMessage is a string containing a detailed message to display when condition returns false.
To call the Debug class without explicitly including the namespace, you need to import the System.Diagnostics namespace using the Imports directive, as described in the preceding examples.
EAN: 2147483647
Pages: 126