Using the SVG marker Element
|
|
|
Dotted and Dashed Line Segments
Consider the set of dotted and dashed line segments in Figure 2.5.
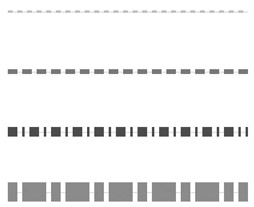
Figure 2.5: Dotted and dashed lines.
The SVG document in Listing 2.7 renders a set of parallel horizontal line segments with dotted and dashed patterns.
Listing 2.7 dottedDashedLines1.svg
<?xml version="1.0" encoding="iso-8859-1"?> <!DOCTYPE svg PUBLIC "-//W3C//DTD SVG 20001102//EN" "http://www.w3.org/TR/2000/CR-SVG-20001102/DTD/svg-20001102.dtd"> <svg width="100%" height="100%"> <defs> <line x1="0" y1="0" x2="200" y2="0"/> </defs> <use xlink:href="#lineDefinition1" x="50" y="50" stroke="red" stroke-width="1" stroke-dasharray="4 4"/> <use xlink:href="#lineDefinition1" x="50" y="100" stroke="green" stroke-width="4" stroke-dasharray="8 4"/> <use xlink:href="#lineDefinition1" x="50" y="150" stroke="blue" stroke-width="8" stroke-dasharray="8 4 2 4"/> <use xlink:href="#lineDefinition1" x="50" y="200" stroke="red" stroke-width="16" stroke-dasharray="8 4 20 4"/> </svg>
Remarks
Listing 2.7 contains an SVG defs element that specifies the two end points of a line segment. Notice the four SVG use elements, each of which references the same line segment by the value of its id attribute (which is lineDefinition1) in order to render four parallel line segments. The start point for each of the four line segments is specified by the value of the x attribute and the y attribute that is listed inside each SVG use element. This technique is convenient when there are multiple objects with the same dimensions. The code is compact because you specify the definition of the object once; moreover, it's much easier to update the defined object instead of making the same change in multiple locations (imagine updating the width of several thousand rectangles!).
By the way, if nothing is rendered in your browser, make sure that you did not inadvertently forget the '#' symbol (that can easily happen when you're in a hurry). Each line segment contains a different left end point that is determined by the value of the x attribute and the y attribute. The attribute stroke-dasharray determines the dot and dash pattern. Usually this attribute consists of one or more pairs of numbers, where each pair specifies the length of a line segment followed by the length of white space. (Can you guess what will happen with an odd number of numbers? Try it and see if you were right!)
You can also specify values for the stroke, stroke-width, and stroke-dasharray attributes when using SVG elements such as rect and ellipse. The judicious choice of values for these attributes can add vividness to histograms, line graphs, and pie charts.
|
|
|
EAN: 2147483647
Pages: 362