Drawing Variable Bar Sets
|
|
|
Drawing Labeled Rectangular Grids
Consider the labeled grid in Figure 10.3.
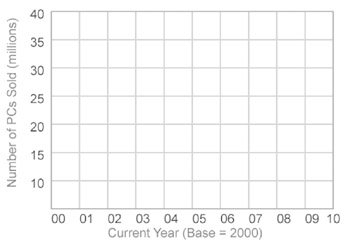
Figure 10.3: A labeled grid.
The SVG document labeledGrid1.svg in Listing 10.3 demonstrates how to render a grid with labeled vertical and horizontal axes.
Listing 10.3 labeledGrid1.svg
<?xml version="1.0" encoding="iso-8859-1"?> <!DOCTYPE svg PUBLIC "-//W3C//DTD SVG 20001102//EN" "http://www.w3.org/TR/2000/CR-SVG-20001102/DTD/svg-20001102.dtd"> <svg width="100%" height="100%"> <defs> <pattern width="40" height="40" patternUnits="userSpaceOnUse"> <rect x="0" y="0" width="40" height="40" style="fill:none;stroke:blue; stroke-width:1;fill-opacity:.5;"/> </pattern> </defs> <!-- *** render background grid *** --> <g transform="translate(80,30)"> <rect fill="url(#gridPattern)" style="stroke:red;fill-opacity:.2" x="0" y="0" width="400" height="280"> </rect> </g> <!-- *** text label (vertical axis) *** --> <g transform="translate(30,300)"> <text x="20" y="0" transform="rotate(-90)" fill="red" font-size="18"> Number of PCs Sold (millions) </text> </g> <!-- *** unit label (vertical axis) *** --> <g transform="translate(50,280)"> <text x="0" y="0" fill="blue" fill-opacity="1" font-size="18">10</text> </g> <g transform="translate(50,240)"> <text x="0" y="0" fill="blue" fill-opacity="1" font-size="18">15</text> </g> <g transform="translate(50,200)"> <text x="0" y="0" fill="blue" fill-opacity="1" font-size="18">20</text> </g> <g transform="translate(50,160)"> <text x="0" y="0" fill="blue" fill-opacity="1" font-size="18">25</text> </g> <g transform="translate(50,120)"> <text x="0" y="0" fill="blue" fill-opacity="1" font-size="18">30</text> </g> <g transform="translate(50,80)"> <text x="0" y="0" fill="blue" fill-opacity="1" font-size="18">35</text> </g> <g transform="translate(50,40)"> <text x="0" y="0" fill="blue" fill-opacity="1" font-size="18">40</text> </g> <!-- *** text label (horizontal axis) *** --> <g transform="translate(160,350)"> <text x="0" y="0" fill="red" fill-opacity="1" font-size="18"> Current Year (Base = 2000) </text> </g> <!-- *** unit label (horizontal axis) *** --> <g transform="translate(80,330)"> <text x="0" y="0" fill="blue" fill-opacity="1" font-size="18">00</text> </g> <g transform="translate(120,330)"> <text x="0" y="0" fill="blue" fill-opacity="1" font-size="18">01</text> </g> <g transform="translate(160,330)"> <text x="0" y="0" fill="blue" fill-opacity="1" font-size="18">02</text> </g> <!-- similar blocks omitted for brevity --> </svg>
Remarks
Although the SVG code in Listing 10.3 contains much more code than Listing 10.2, much of the code is very similar in nature. Some of the code has been omitted for brevity, and you can find the complete code for in the folder for this chapter on the accompanying CD-ROM. You can see how the SVG code has been labeled with comments that make it easier to understand as well as simplifying code maintenance.
The first part of Listing 10.3 contains an SVG defs element for defining a grid-like pattern that is used in step 1 in order to render a background grid for the graph.
Step 2 of the SVG code contains a rotated line segment and a rotated text string that labels the vertical axis.
Step 3 of the SVG code renders a set of short horizontal line segments as the 'hash' marks for the vertical axis.
Step 4 of the SVG code renders a text string that labels the horizontal axis.
Step 5 of the SVG code renders a set of short vertical line segments as the 'hash' marks for the horizontal axis.
Now that you understand how to create a labeled grid in SVG, you can use this code as a 'template' for your own graphs. You can easily make your own custom enhancements (e.g., dotted internal line segments with differing colors) in order to tailor the appearance of this grid to each of your custom graphs.
|
|
|
EAN: 2147483647
Pages: 362