Certification Objective 6.01: Creating a Conceptual Model of Business Requirements
The goal of the conceptual design phase is to analyze the business and user requirements defined in previous design steps and to design a system that can meet all the identified needs of the user. This process of conceptual application design follows a path very similar to the path to the ORM conceptual design process that we examined in the last chapter. There are three major tasks to complete when creating the conceptual system model:
-
Identify the system entities
-
Establish the relationships among those system entities
-
Document system flows
The conceptual schema developed during the ORM database design stage will likely contain many of the entities we will use in the conceptual application design. In addition, the conceptual schema conveniently incorporates many of the business rules governing the relationships between those entities. But when it comes to system design, in many cases the entities identified during that phase will not fully address the needs of the system. Often, there are many parts of the application that are not heavily integrated into the database model.
The first step of conceptual design is to identify the entities that comprise a system. Identifying system entities is a process by which the conceptual components of the system are derived from the business rules. Although these entities are usually similar to those defined during conceptual database design, often times there will be entities that are not represented in the database, such as printers, e-mail accounts, application web sites, Interactive Voice Response (IVR) telephone systems, and so on.
The second step of conceptual design is to establish the relationships among entities identified during the first step. This process helps us understand the system pathways over which information will flow. For instance, both the web site and the IVR system might need to connect to the database to retrieve information, but it is unlikely they would need to connect to each other. It is important to diagram both the internal and external system relationships in this step.
The third and final step of conceptual application design is to document how information travels through the system. This involves converting the predefined business rules into flowcharts and data flow diagrams. These diagrams each serve their own useful purposes. After all, as the old saying goes, a picture is worth a thousand words. It is a fact that humans process information visually better than in any other way, so it is well worth the effort to create these conceptual design diagrams to help us when we have to turn our system design into a logical design.
| Exam Watch | It is important to understand the difference between conceptual and logical design before taking the MCSD 70-300 exam. Conceptual design aims to document system processes as a series of steps and identify the packets of data that flow among these processes, based on the business requirements defined in an earlier design phase. Logical design incorporates technical considerations into the design, such as security and error handling, and builds classes and objects based on the entities defined during the conceptual phase. |
Procedure Diagrams
One of the first conceptual design diagrams that should be constructed is the procedure diagram. The procedure diagram serves to document a process or procedure as a series of steps. To indicate when decisions need to be made during the process, the diagram can be split into two or more paths. This type of diagram is sometimes called a flowchart or workflow diagram.
Figure 6-1 is an example of a typical procedure diagram. This example shows the procedure of a customer purchasing a book from a bookstore, from the time the customer presents the book to the cashier until the time the sale is complete.
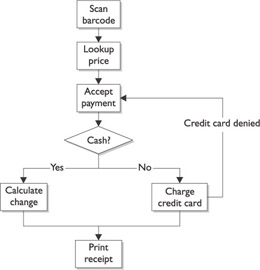
Figure 6-1: A typical procedure diagram
Obviously, all of the procedures of a complex system cannot possibly be summarized in a single procedure diagram. For this reason, procedure diagrams should be clearly named according to the process they are trying to document in order to avoid confusion among multiple diagrams. It is also important to remember that many tasks integral to the success of a business are not considered system procedures. For instance, accepting a delivery of books by signing a purchase order presented by the delivery company does not belong in a procedure diagram because it is not a conceptual part of the system design. Adding those books to store inventory, however, would be included in the system conceptual design.
A Simple Procedure Modeling Methodology
As you’ll recall from Chapter 3, the business requirements design and analysis part of the planning phase identified a number of core requirements the application has to fulfill in order to meet the needs of the client. These requirements are most likely stated something like this:
“1.1 The application will allow bookstore employees to look up a book By Title or By ISBN Number to see how many copies of that book remain in inventory.”
This business requirement implies a certain workflow and is very specific about the desired system functionality. Requirements will likely specify how users will employ a system and the way in which the application should respond. For instance, the preceding example business requirement can be broken down into a series of steps.
The steps involved in searching for books in inventory are as follows:
-
The system accepts some search terms from the bookstore employee.
-
If the employees are searching By ISBN, proceed to step 3; otherwise, proceed to step 5.
-
The system checks for any books in the book database corresponding to that ISBN.
-
Proceed to step 9.
-
If the employees are searching By Title, proceed to step 6; otherwise, proceed to step 8.
-
The system checks for any books in the database corresponding to that title.
-
Proceed to step 9.
-
Display invalid search message and stop.
-
If no books that match the search terms can be found, proceed to step 10; otherwise, proceed to step 11.
-
Display an out-of-stock message and stop.
-
Display the inventory count and stop.
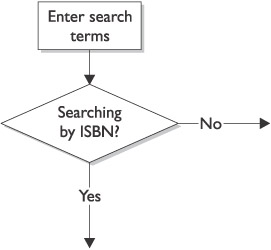
These eleven steps can be depicted graphically using a procedure diagram. Each step in the preceding list will appear in our diagram. For instance, the first step is represented with the following symbol:

This step indicates a system or user action and is drawn graphically as a rectangle. The name of the action is written inside the rectangle so that it can be easily identified as the diagram gets more complex.
The second step in our 11-step process is not an action but a decision. Diamond shapes in the procedure diagram represent decisions that must be made by the system. The following illustration shows steps one and two, linked together by an arrow representing process flow.
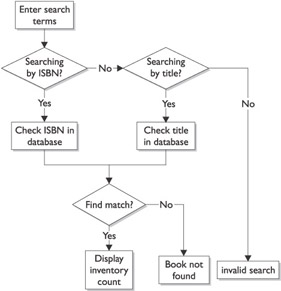
Decision diamonds usually have two or more arrows coming out of them to represent the choices the system or user has to make. For instance, our application has to distinguish between ISBN and title searches because the type of database query is different in each instance. The following illustration depicts the full procedure diagram for the task of using the application to search for a book.
| Author's Note | Procedure diagrams are usually drawn so that they can be read from either top to bottom or left to right. This makes them easier to read. |
Our process for the task “Search for a Book” begins with the first step, Enter search terms. We know this is the first step because there are no arrows leading into the action. Also, the fact that this step is at the top of the diagram is a good clue that we should start there. As we proceed through the workflow, we are presented with a number of choices, such as Searching by ISBN?. Our process will traverse only one of the decision arrows coming out of that diamond: either Yes or No. Eventually we make our way to the end of the process, such as the action Display inventory count. Once this task is complete, the process is over. We can tell that the process is over because there are no arrows leading away from this action.
We may want to number the steps in this process (as 1, 2, 3, and so on), although it sometimes makes things more confusing on a diagram such as this. One reason numbering the steps on the diagram may be confusing is that the steps are usually not executed in sequential order—some steps would be skipped depending on the decisions encountered. The most useful way to keep these diagrams effective is to keep them simple and easy to read. Don’t try to put too many actions in one procedure diagram. Break up the diagram if possible.
| On The Job | The activities contained within a procedure diagram are usually labeled on the actual diagram to make it easier for other documents to refer to them. For instance, tasks can be numbered in sequential order using point notation, such as 1.1.1, 1.1.2, 1.1.3, and so on, or sometimes the tasks are both numbered and lettered, such as A1, A2, A3, and so on. If you are going to do this, make sure the labels are unique across all procedure diagrams. |
Exercise 6-1: Using Visio for Enterprise Architects to Create Procedure Diagrams
Note that this exercise requires the Visio for Enterprise Architects software that comes bundled in Visual Studio .NET Enterprise Architect edition. It can be performed inside previous versions of Visio, but the steps are a bit different.
Microsoft Visio does not contain any special templates for creating procedure diagrams for conceptual design. It does, however, contain a flowchart template, which contains the appropriate symbols and connectors we need to create a procedure diagram. In this exercise, we will create a fairly simple procedure diagram using Visio.
-
Click Start | All Programs and choose Microsoft Visio to start the application.
-
Click File | New | Flowchart and select Basic Flowchart to create a blank flowchart.
-
Drag a Process rectangle from the template area on the left onto the blank page. Label the process Create cheeseburger.
-
Drag a Decision diamond onto the page to a spot one inch below the first Process rectangle. Label the diamond French fries?.
-
Drag a Dynamic Connector onto the page and connect the bottom of the Process rectangle with the top of the Decision diamond, making sure the arrow is leading away from the rectangle.
-
Drag a second Process rectangle onto the page to a spot one inch beneath the Decision diamond. Label the second process Create French fries.
-
Drag a Dynamic Connector onto the page and connect the bottom of the Decision diamond with the top of the second Process rectangle, making sure the arrow is leading away from the diamond. Label the arrow Yes.
-
Drag a third Process rectangle onto the page to a spot one inch to the right of the Decision diamond. Label the third process Deliver meal.
-
Drag a Dynamic Connector onto the page and connect the right side of the Decision diamond with the left side of the third Process rectangle, making sure the arrow is leading away from the diamond. Label the arrow No.
-
Drag a Dynamic Connector onto the page and connect the right side of the second Process rectangle (“Create French fries”) with the left side of the third Process rectangle (“Deliver meal”), making sure the arrow is leading away from the second process.
-
Click File | Save As and assign your diagram a name. Click the Save button to save the diagram.
Data Flow Diagrams
Whereas a procedure diagram concentrates on the process flow of a system, a data flow diagram (DFD) documents the flow of data throughout that system. This type of diagram describes interactions between a system and its database so programmers can easily see what happens to data once it is read from a database and how data is collected before it gets written to a database.
Figure 6-2 shows a good example of a DFD. This diagram shows the flow of data in a simplified cash register application. We can see how data gets entered into the system using a scanner and a database of prices and how it is output from the system to a cash register display and a sales receipt, and saved to a transaction database.
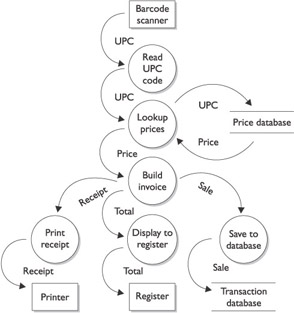
Figure 6-2: A typical data flow diagram, which documents the data interactions of a system
In fact, a DFD really is a diagram that shows how data is processed by a system by defining the inputs and outputs. Inputs are typically entered into a keyboard, a database, an external data file, a web form, an Interactive Voice Response (IVR) telephone system, and other input devices. Output can be sent to a screen, a printer, a database, a web service, and other output devices. Data can travel through several processes on its path from input to output, or it can be used entirely in one process. For instance, a single process can read, modify and update a database without passing that data to any other process in the system.
Like procedure diagrams, DFDs can be drawn using several levels of granularity. A DFD can be fairly high level, looking at a complex system in a fairly abstract manner. For instance, a high-level DFD can display the data flow for a complex sales and inventory system. Within this high-level diagram, the retail sales process might be represented by a single entity. A lower-level DFD might focus on a specific process within a complex system. For instance, it is possible for a DFD to display data flow within the retail sales process only. This low-level diagram could contain a dozen or so entities, but is definitely more detailed than the high-level diagram.
Another similarity between procedure diagrams and DFDs is that it would be very difficult, and even impractical, to create a single diagram to define an entire system at a low level. It almost goes against the principals of object-oriented software design to even try. It is better to treat the system in a modularized manner, treating the retail sales process as a module unto itself. All you have to do is make sure this process can get the data it needs to succeed and that it provides other processes the data they need as well.
Two well-known notations exist for the drawing DFDs: Yourdon & Coad and Gane-Sarson. The Yourdon & Coad methodology influenced the design of UML, and Yourdon and Coad’s books on software design methodologies—entitled Object-Oriented Analysis (Prentice Hall, 1990) and Object-Oriented Design (Pearson Education, 1991)—are considered key early texts on the subject. The Gane-Sarson methodology is fairly similar to Yourdon & Coad, although the symbols used are slightly different. Basically, when mapping data flows between processes in systems, you are not going to find a lot of difference between different methodologies.
Four items typically are depicted in any data flow diagram:
-
Process
-
Database or data store
-
Data flow
-
External entity
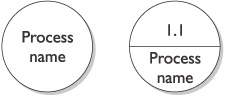
The first item represented in a DFD is a process. A process transforms data that flows into it (the input) into data that flows out of it (the output). In the Yourdon & Coad notation, a circle depicts a process, and the name or description of the process is placed inside the circle. Sometimes, a process is assigned a number to make it easier to refer to the process in specifications and other documentation. The following illustration gives two examples of a Yourdon & Coad process notation:
In Gane-Sarson notation, a process is depicted by a rectangle with rounded corners. The name or description of the process is placed inside the rectangle to identify the task the process performs. The following illustration gives an example of a Gane-Sarson process notation:

The second item represented in a DFD is a database, or data store. Data stores are repositories of data in the system. They are typically relational databases, flat files, or any other repository for storing data (other than computer memory, of course). In Yourdon & Coad notation, data stores are depicted by two parallel horizontal lines. The name or description of the data being stored is written between the lines, as follows:
![]()
In Gane-Sarson notation, a data store is depicted by an open-ended rectangle, as in this example:
![]()
The third important item in a DFD is the data flow. A data flow is a channel or pipeline through which packets of information flow. In both the Yourdon & Coad and Gane-Sarson notations, data flows are depicted by a line with an arrow at one end. These lines are usually labeled with a name or description of the data flow (a noun, such as Order or Invoice). The arrow points in the direction in which the data is flowing. Data flows connect processes, data stores, and external entities.
![]()
The fourth important item in a DFD is an external entity. An external entity is an object, an application, or people outside this system with which the system communicates. For example, a sales cashier is an external entity. Any information that the sales cashier enters into the application is a data flow from an external entity to a process within the system. External entities are represented by rectangles, and as you’d expect, the name or description of the entity (a noun, such as Customer or Data Entry Clerk) is written inside this rectangle.

| To add a process entity to a data flow diagram,… | Use a circle |
| To add a database or data store entity to a data flow diagram,… | Use a pair of parallel lines |
| To add data flow between two entities,… | Use an arrow |
| To add an external entity,… | Use a rectangle |
There are a few basic rules for creating DFDs:
-
Never connect two external entities to each other, because the DFD is concerned only with documenting the processes that affect the system.
-
Never connect two data stores to each other, because by definition data stores have no business logic. (They only store data.)
-
All processes must have at least one input and one output data flow, although some processes gather data from more than one source and provide data to more than one other entity.
If your application is fairly large and complex, there could be dozens of DFDs. Since DFDs document the flow of data through the system, every possible situation where data is read or modified must be covered.
| Exam Watch | Although you will not have to draw conceptual diagrams for this exam, you may have to be able to read them. |
Exercise 6-2: Creating Gane-Sarson Data Flow Diagrams in Visio
Note that this exercise requires the Visio for Enterprise Architects software that comes bundled in Visual Studio .NET Enterprise Architect edition.
Microsoft Visio for Enterprise Architects contains a template specifically for the Gane-Sarson DFD notation. It does not contain a template for the Yourdon & Coad notation. In this exercise, we will create a fairly simple DFD using Visio.
-
Click Start | All Programs and choose Microsoft Visio to start the application.
-
Click File | New | Software and select Data Flow Model Diagram to create a blank Gane-Sarson diagram.
-
Drag a Process from the template onto the blank page. Label the Process Gather customer info.
-
Drag a Data Store from the template onto the blank page. Label the data store Customer.
-
Drag a Data Flow Connector from the template onto the blank page, connecting the Process with the Data Store. Make sure the data flow is originating from the database and flowing into the Process, and label it Customer Info.
-
Click File | Save As and assign your diagram a name. Click the Save button to save the diagram.
Cross-Referencing Matrices
Once you have gone through the process of creating a conceptual data model (through ORM) and you have created high-level procedure diagrams and a hierarchy of DFDs, it is a good idea to summarize these documents in a cross-referencing matrix. A grid that has been properly cross-referenced, or even a series of grids for complex systems, will help organize all of these conceptual design artifacts into an index. These matrices serve as convenient places for looking up the conceptual design of the system.
Typically, this section of the conceptual system design document lists, in a table or matrix, all of the DFDs associated with each process, external entity, or data store. If the system you are designing has dozens of procedure and data flow diagrams, spending time creating a matrix that lists how these diagrams relate to one another is time well spent.
User Interface Conceptual Design
Many would believe that thinking about user interface design during the conceptual design stage might be a little premature; but when you think about it, user interface designers have everything they need at this stage to get started on a basic user interface design:
-
The users of the application have been defined during the user requirements stage.
-
The required functionality of the application has been defined during the business requirements stage.
-
An idea of the target platform and operating system (for example, if it will be a Windows application or a web application) has been defined during the solution concept stage.
Gathering User Profiles
Some applications are designed with just one group of users in mind. For instance, a data entry application may need to concern itself only with data entry clerks. If an application will have only one group of users, it makes things a bit easier when thinking about strategies for design.
| Exam Watch | You will not be asked about conceptual user interface design on the MCSD 70-300 exam. |
However, many applications have more than one category of user. A data entry application might very well need to support managers who can approve batches of records and run various reports. It may also need to support systems administrators who can create new users or archive records that are more than a few years old. Applications that need to support more than one category of user make things slightly more complex when designing a user interface to support them all.
In any event, whether you are designing an application that will be used by only one person, by one group within a company, or by every employee throughout the company, it is important to gain an understanding about the potential users, and this is done by creating user profiles.
A user profile is a description of the users that will be using the application and their specific characteristics. Before approaching actual graphical user interface design, it is important to understand user characteristics such as the following:
-
Psychology-related characteristics (for instance, attitude and motivation)
-
Experience-related characteristics (for instance, computer skills)
-
Job-related characteristics (for instance, which areas of the application will likely be used the most)
-
Other characteristics (for instance, fluency in English)
Having these insights into the nature of the users will help you make design decisions down the road. For example, if a good number of your potential users have never used a computer, it will have an effect on the user interface that is ultimately designed.
Building the Application Site Map
Creating a conceptual design for a user interface requires developers to think about the organization of the application from the user’s perspective. The techniques for creating the conceptual model at this stage of design are remarkably similar to the techniques for other conceptual models we have created thus far. A conceptual user interface model resembles a hierarchical chart of screens, making it easy for a designer to envision how users proceed through their tasks when using the application. After all, an application is really just a tool—users will want to use that tool to perform some task reliably and without unnecessary complexity.
The conceptual user interface design typically is a diagram of boxes and arrows that connect the proposed screens of the application in order to show how the application’s users will proceed through the application performing their daily tasks. Web site designers would call this a site map, and the metaphor can be extended to regular Windows application design. (.NET blurs the lines between web and Windows applications anyway because ASP.NET applications are constructed within the Visual Studio .NET environment alongside VB .NET and other graphical Windows applications.)
Conceptual user interface design starts by identifying the likely “top-level screens” of the application being designed. These screens become the functional categories of an application, and they can usually be derived from the business requirements documents. Following are some examples of top-level screens:
-
Data entry screens
-
Data review and approval screens
-
Report-generation screens
-
Administrator screens
This list is an example of the functional categories of a data entry application that I recently worked on. From these top-level screens, we can begin to get an idea about how the application’s user interface should be organized. We can draw a simple diagram, the hierarchical chart shown in Figure 6-3, to show how users are likely to proceed through the application at this point.
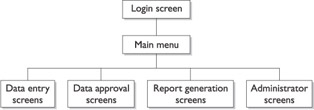
Figure 6-3: A hierarchical diagram of the top-level screens of a simple data entry application
Note that we haven’t yet begun to think about colors, logos, navigation bars, and other graphical components of the application. These elements will certainly come into play when we begin designing and developing screens, but we are still at the boxes and arrows stage at this point.
| On The Job | Programmers generally make bad user interface designers. There are many reasons why this is often true, but the one I like the most is that good user interface design requires so-called “soft skills” such as psychology, ergonomics, and the understanding of other human factors. |
The user interface is one of the most subjective areas of application design. There are many ways to design an application correctly. Which design is the best can only be determined by the users themselves—after they have had a chance to see the efficiency and effectiveness of each user interface design in action.
| To create the conceptual design of a database,… | Use Object Role Modeling (ORM) |
| To create a procedure diagram,… | Use flowcharts or UML activity diagrams |
| To create a data flow diagram,… | Use Yourdon & Coad or Gane-Sarson diagrams |
EAN: 2147483647
Pages: 94