Chapter 18. Stack Tracebacks
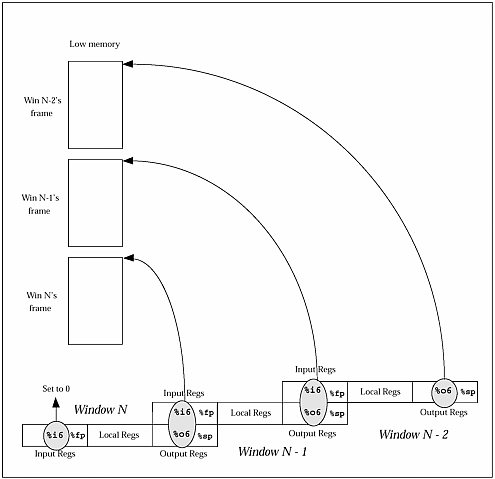
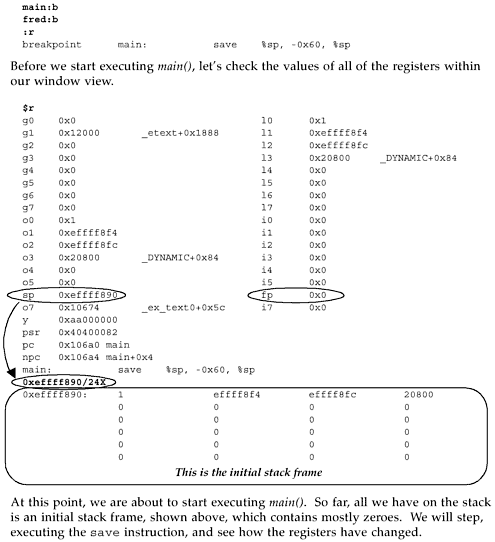
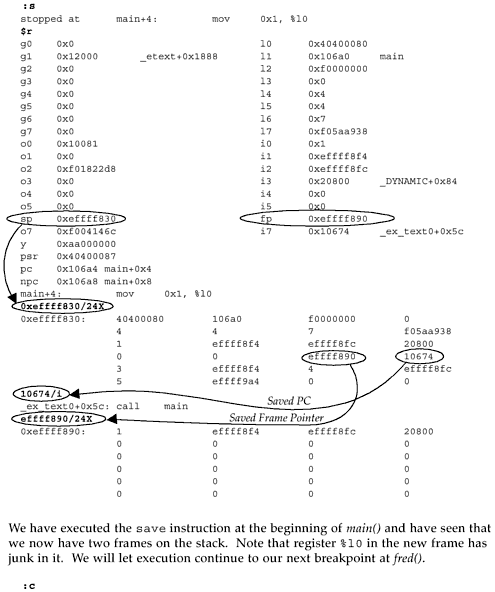
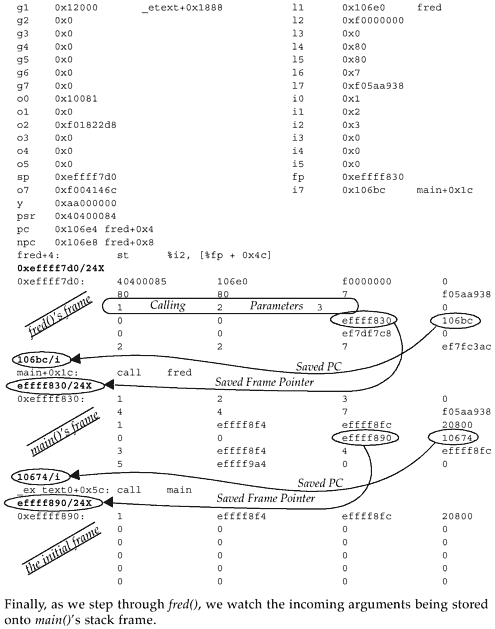
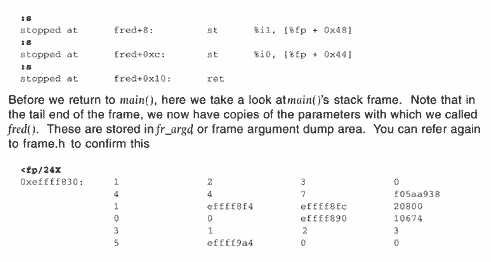
| We've spent enough time talking about stacks. Now let's see the theory put to actual use. We will start by using the little C program below, which we will run under adb . Example 18-1 little.c main () { fred (1, 2, 3); } int fred (a, b, c) int a, b, c; {} In little.c , shown above, the main() routine calls the fred() routine, passing it three integer values. The fred() routine does nothing except return to the main() routine. Using adb , let's first look at the SPARC assembly instructions for main() . Figure 18-1 Viewing little's main routine via adbHiya... cc -o little little.c Hiya... adb little - main,20?ai main: main: save %sp, -0x60, %sp main+4: mov 0x1, %l0 main+8: mov 0x2, %l1 main+0xc: mov 0x3, %l2 main+0x10: mov %l0, %o0 main+0x14: mov %l1, %o1 main+0x18: mov %l2, %o2 main+0x1c: call fred main+0x20: nop main+0x24: ret main+0x28: restore Starting at main, we have requested to see the first 20 hex (32 decimal) instructions of main() . We've trimmed the output shown above to just show the main() routine. Main() first executes a save instruction, which adjusts the stack pointer, growing the stack downward towards low memory by 60 hex bytes (96 decimal) or 24 words. If you look again at frame.h , you'll see that 24 words is the size of the smallest frame we would expect to see. The save instruction will result in a new window, but when we actually get around to looking at the program with adb , the registers will have been flushed out to the stack by the kernel, since the program will no longer be running (it will be stopped and waiting). Next, main() loads values into registers %o0 , %o1 , and %o2 in preparation for passing them as parameters to fred() . Instead of doing this directly, the values are first loaded into local, or %l registers, then moved to the output registers. Why? You would have to ask the compiler that question. However, this was compiled without using the optimizer, which often results in rather inefficient code. Next, we call fred() . Figure 18-2 Viewing little's fred routine via adb fred,10?ai fred: fred: save %sp, -0x60, %sp fred+4: st %i2, [%fp + 0x4c] fred+8: st %i1, [%fp + 0x48] fred+0xc: st %i0, [%fp + 0x44] fred+0x10: ret fred+0x14: restore In fred() , we execute another save instruction, thus pushing another frame of minimum size onto the stack. This is the first time we see %fp in use. %fp is simply another name for the caller's %sp . Using %fp as a reference, we save the incoming arguments from main() onto the stack. Why does this happen? Again, you'd have to chat with the compiler about this. From fred() we return to main() , which in turn returns control to the routines responsible for managing the execution of object files for us. The following diagram is offered to help you understand the relationship between %fp , or the frame pointer (the caller's stack pointer), and %sp, the callee's stack pointer. Figure 18-3. Relationship between %fp Frame Pointers and %sp Stack Pointers Okay! Let's get back to adb now and watch the stack grow! If this is your first time walking a stack with adb , you might want to do this on your own computer while using this example as your guide. To help you, we will embed comments throughout the adb session. We end this demonstration here. However, if you wish to continue stepping through to completion, feel free to do so. See if you can predict what will happen to the registers and windows as you step through the restore instructions. What have we accomplished here? We've walked through a very simple, little program, examining the stack as it grows and watching the window registers shift. What is important to understand is that whether we are debugging a simple program or part of a UNIX kernel, the concepts of the stack and "walking the stack" are the same. Congratulations! You are now another BIG step closer to being able to analyze UNIX system crash dumps! |
EAN: 2147483647
Pages: 289
